Ticker for May 12, 2011
MESONET TICKER ... MESONET TICKER ... MESONET TICKER ... MESONET TICKER ...
May 12, 2011 May 12, 2011 May 12, 2011 May 12, 2011
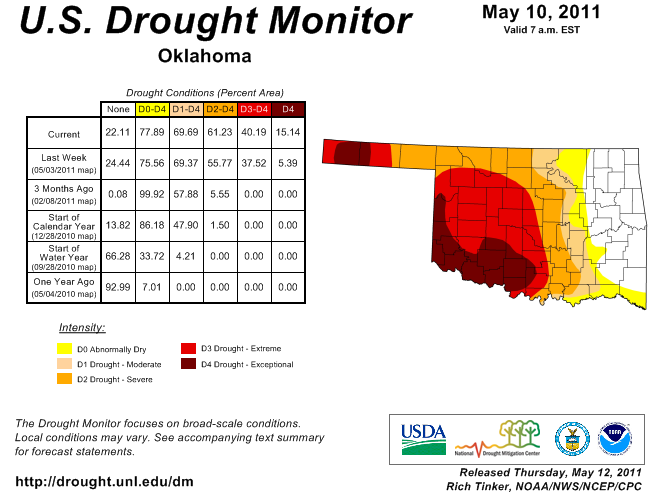
Drought takes a hit in some areas
The newest U.S. Drought Monitor map is out this morning, and you can see an
expansion of D4 drought in southwestern Oklahoma, up through the extreme
western edge of the state, and to the east a bit as well.
Just in the nick of time, a good soaking rainfall occurred in some places that
have missed out here lately, and other areas got a reinforcing dose from the
rains of the previous weeks. Here's a look at the Mesonet rainfall map from
yesterday's storms.
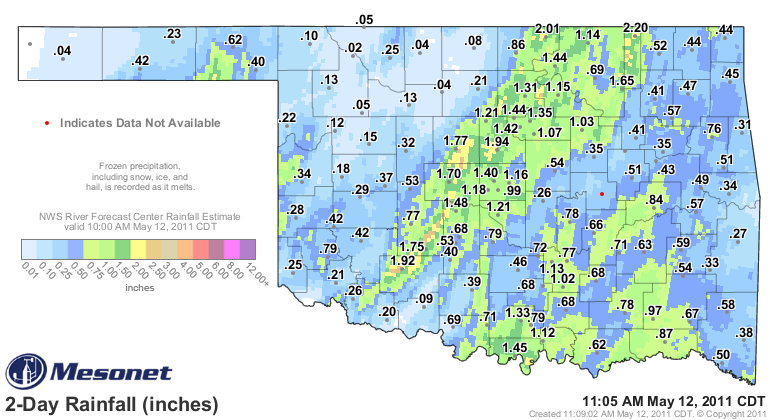
As you can see, a strip from the southwest through north central Oklahoma got
a good dose of 1-2 inches of rain, with similar totals down in south central
Oklahoma. Here are the top-20 rainfall totals from the Oklahoma Mesonet from
the storms:
Copan 2.19" Oklahoma City North 1.39"
Guthrie 1.93" Burbank 1.37"
Medicine Park 1.92" Marena 1.37"
Newkirk 1.91" Burneyville 1.35"
Kingfisher 1.76" Red Rock 1.28"
Apache 1.75" Newport 1.22"
El Reno 1.70" Norman 1.21"
Skiatook 1.64" Marshall 1.21"
Minco 1.48" Oklahoma City West 1.17"
Lake Carl Blackwell 1.41" Spencer 1.15"
Unfortunately, for too many of the have-nots got-not yesterday. Here are the
bottom-10.
Buffalo 0.10"
Walters 0.09"
Medford 0.08"
May Ranch 0.05"
Seiling 0.05"
Boise City 0.04"
Cherokee 0.04"
Lahoma 0.04"
Freedom 0.02"
Kenton 0.00"
Hectorville 0.00"
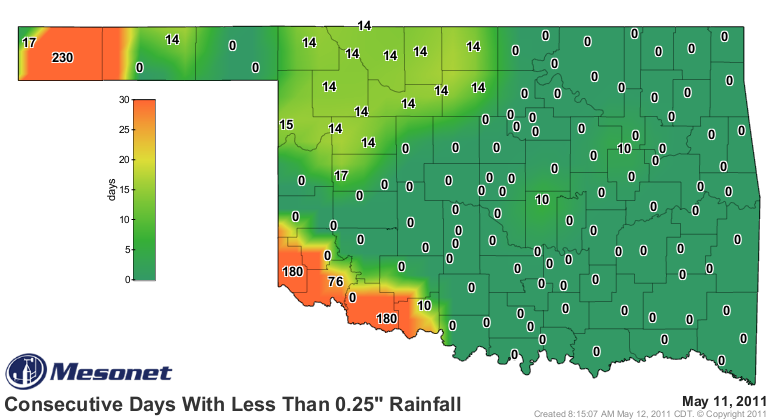
The have-nots include Boise City, Grandfield and Hollis -- continuing members
of the quarter-inch crowd at 230 days and 180 days (X2), respectively.
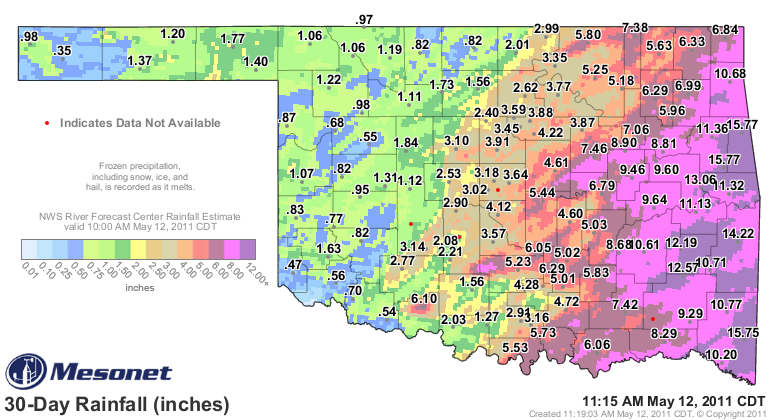
The 30-day map is still showing that area which remains in the worst of the
drought designation, including much of western Oklahoma. For those areas that
have now seen a good 2-4 inches of rain along I-35, that a heckuva start at
drought relief!
More good news, the 6-10 and 8-14 day outlooks from the Climate Prediction
Center indicate an increased chance of above normal precipitation for the state
from about May 17-25. Now keep in mind that those don't say HOW MUCH above
normal it could be. Those maps show probability. So the darker green areas
are areas of greater probability of above normal rains, not areas that will
necessarily be wetter than those shaded in a lighter green.
At this point, I'll take any good news that comes along, and a possible pattern
shift is just what the drought doctor ordered.
It's weather, though. Malpractice is always a concern.
Gary McManus
Associate State Climatologist
Oklahoma Climatological Survey
(405) 325-2253
gmcmanus@mesonet.org
May 12 in Mesonet History
| Record | Value | Station | Year |
|---|---|---|---|
| Maximum Temperature | 99°F | HOOK | 2022 |
| Minimum Temperature | 36°F | ANTL | 2008 |
| Maximum Rainfall | 5.55 inches | COOK | 2016 |
Mesonet records begin in 1994.
Search by Date
If you're a bit off, don't worry, because just like horseshoes, “almost” counts on the Ticker website!