Ticker for November 19, 2010
MESONET TICKER ... MESONET TICKER ... MESONET TICKER ... MESONET TICKER ...
November 19, 2010 November 19, 2010 November 19, 2010 November 19, 2010
Fa La La La Laaaaaaa, La La Ninaaaaaaaaaaaaa
The updated outlooks for December and the rest of winter are out from the NWS'
Climate Prediction Center and they are still indicating a classic La Nina pattern
will be present for the southern parts of the United States (i.e., mostly warmer
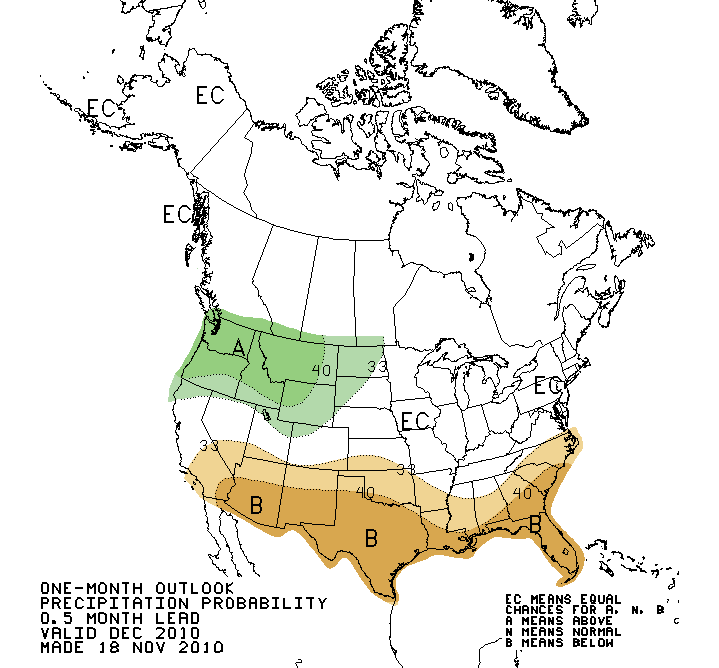
and drier than normal). Here's a peek at the December outlooks:
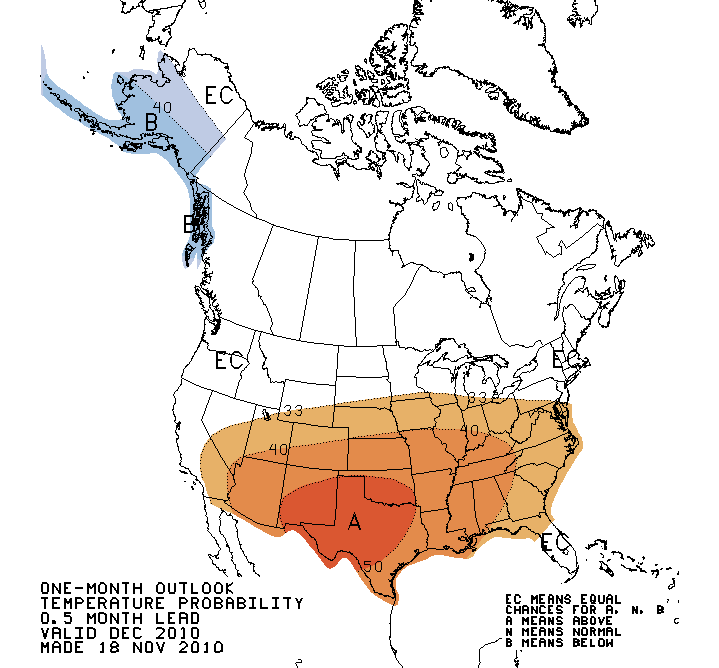
On the temperature side, the forecasters are betting 50 cents out of their
forecast dollar that much of Oklahoma will end up with an above-average December
when the month is over. By betting their 50 cents there, they are taking away
17 cents from the below normal category and leaving the "chances for normal"
category at 33 cents. So basically their confidence levels for each category are:
Above normal = 50%
Near normal = 33%
Below normal = 17%
What do they mean by an above average December temperature? Simple. Take the
average December temperatures from 1971-2000 period and divide those 30
temperatures up into 3 categories:
A -- The 10 warmest
B -- The 10 coolest
N -- The 10 nearest to normal
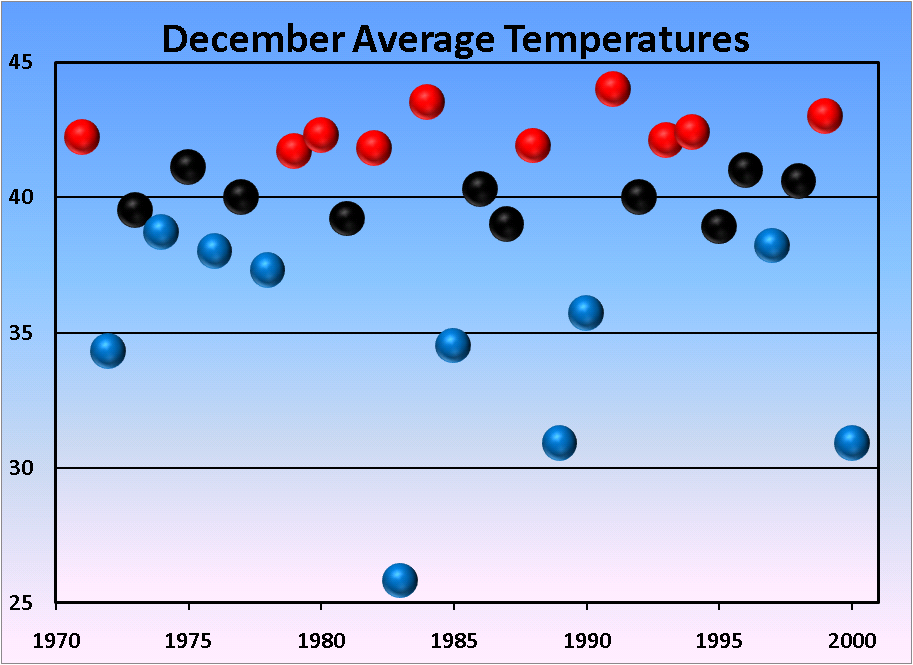
By betting their 50 cents on category A, Above normal, they're indicating our
average December temperature at the end of the month will end up somewhere
amongst these red dots (or higher ... remember, there is no prediction on
magnitude of anomalies in these outlooks). Likewise, they're saying only a
17% chance our temperature at the end of the month will end up amongst the
blue dots (1983 stands out!). These dots represent statewide averages for
simplicity, but they should be calculated for individual areas in the state.
Red dots = warmest 10
Blue dots = coolest 10
Black dots = nearest normal 10
The same concept applies to the precipitation outlooks. Where you see the
white-shaded areas labeled "EC", the forecasters didn't have the tools to show
confidence in any of the categories, so their bet is 33 cents for each of
A, B or N.
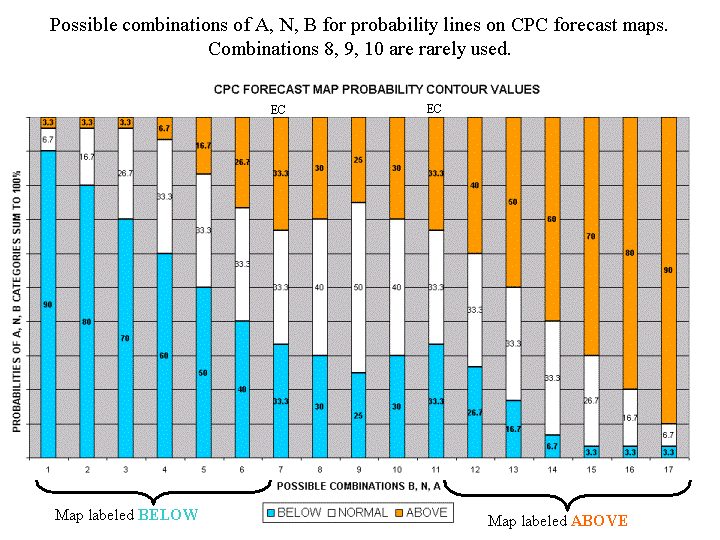
If you want to be REALLY confused, here is a figure that shows how the
confidence levels change for each category as the forecaster slides up and
down the scale:
Here's a look at the December-February outlooks. Their temperature bet for the
winter months as a whole would be above normal and they appear to have folded
their hand for most of the state on the precipitation. I have no idea if they
knew when to walk away, and knew when to run. That's okay because there'll be
time enough for counting when the dealings done.
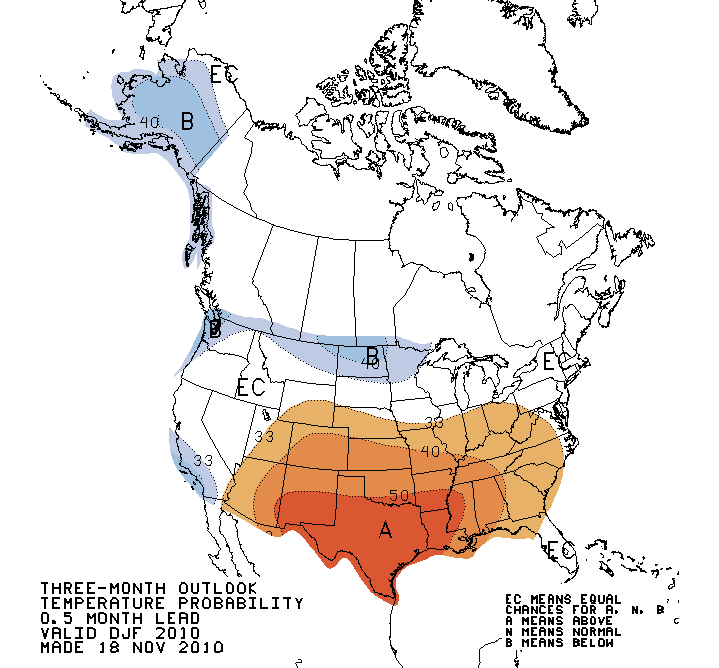
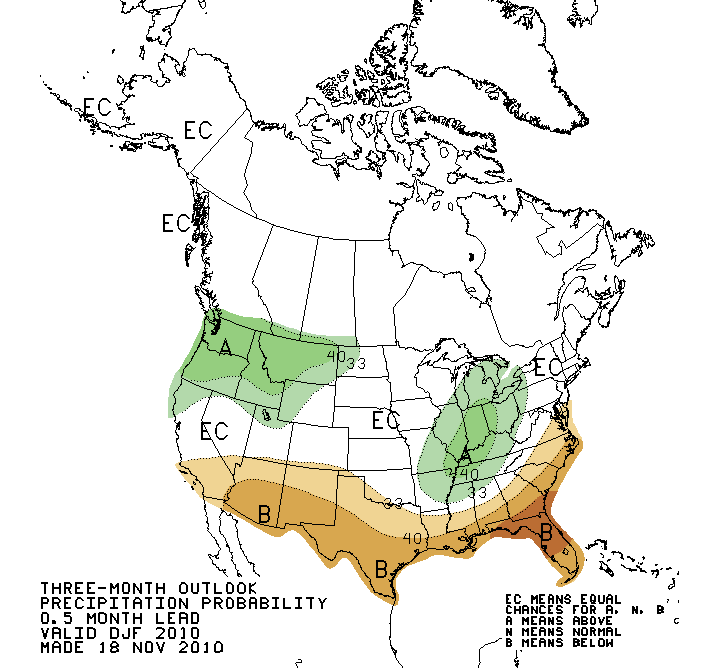
The main reason for what confidence they do have is the presence of a strong La
Nina event. Again, as a note of caution, even if these outlooks verify that
does not mean a complete absence of cold weather or even REALLY cold weather.
It simply means at the end of whatever period is indicated, the temperatures
ended up above average by an undetermined amount. The same holds for the
precipitation outlooks.
Weather will still occur, climate just smooths out the edges. Sometimes those
edges can be doozies, however.
Gary McManus
Associate State Climatologist
Oklahoma Climatological Survey
(405) 325-2253
gmcmanus@mesonet.org
November 19 in Mesonet History
| Record | Value | Station | Year |
|---|---|---|---|
| Maximum Temperature | 86°F | GOOD | 2020 |
| Minimum Temperature | 6°F | KENT | 2022 |
| Maximum Rainfall | 3.26″ | KING | 1994 |
Mesonet records begin in 1994.
Search by Date
If you're a bit off, don't worry, because just like horseshoes, “almost” counts on the Ticker website!