Ticker for January 12, 2010
MESONET TICKER ... MESONET TICKER ... MESONET TICKER ... MESONET TICKER ...
January 12, 2010 January 12, 2010 January 12, 2010 January 12, 2010
Diagnosis: Uncommon Cold
Data from the Oklahoma Mesonet indicate that December 2009 was the 10th coldest
in the state since records began in 1895, nearly 5 degrees below normal.
Statistics released by the National Climatic Data Center indicate a similarly
cold month for the rest of the country with an average temperature more
than 3 degrees below normal and ranked as the 14th coldest on record. The cold
weather coincided with a Christmas Eve blizzard of historical significance for
much of Oklahoma. The extreme cold did not stop with the transition to a new
year ? in fact, it got worse.
Another arctic plunge on January 1 left Oklahoma and much of the eastern
two-thirds of the country in a deep freeze for the next 10 days. Data collected
by the 120 Oklahoma Mesonet stations across the state during this cold-air
outbreak verified what most knew already ? this was some of the coldest air
seen across the state for an extended duration since the cold-air outbreaks of
February 1996 and January 1997. Even these past three events are still a far
cry from the state?s worst cold-air outbreaks of December 1983 and January
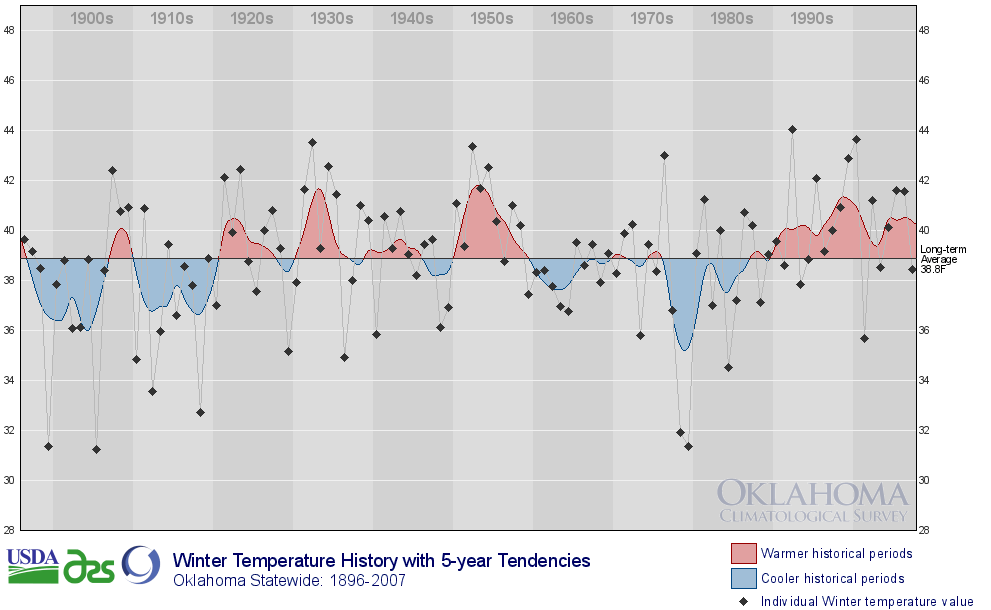
1930, however. Nevertheless, taken in today?s context of our warming winters
since the 1970s, this event was possibly even more extreme relative to normal.
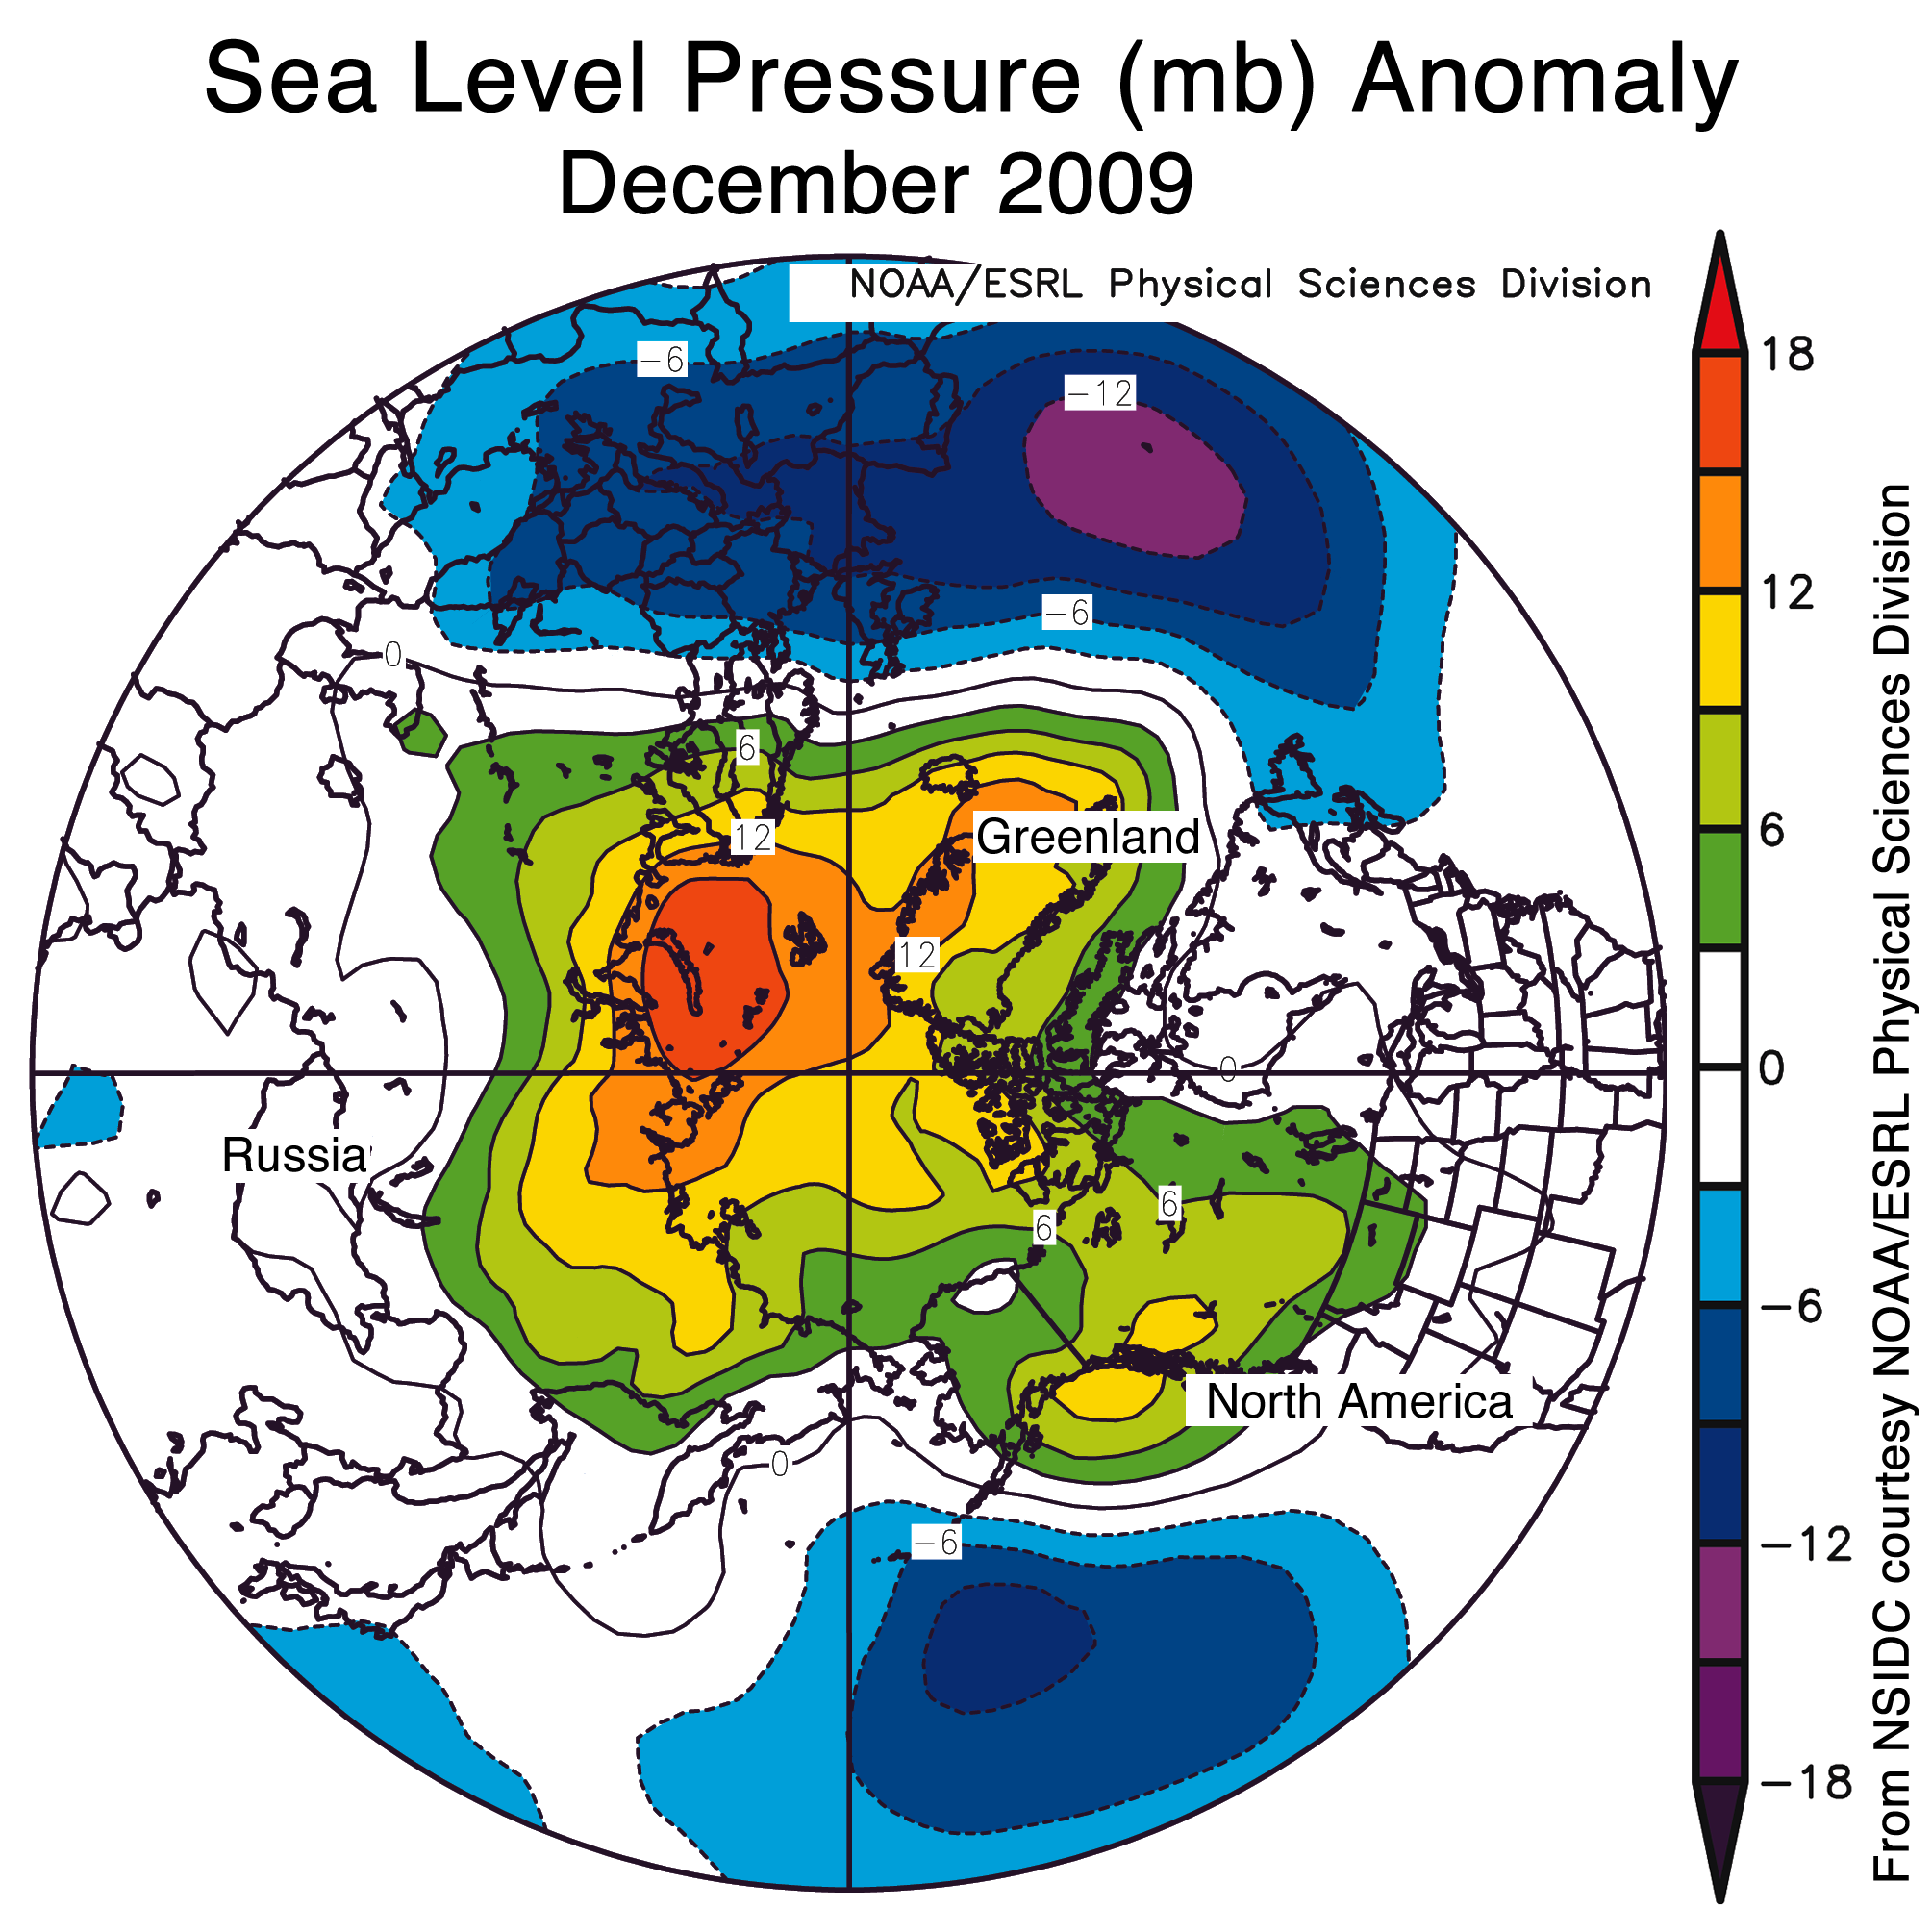
So what brought us our frigid weather of December and early January? The answer
may seem a bit of a paradox, but as it turns out a big dome of high pressure
sitting over Greenland and the Arctic regions diverted cold air farther to the
south. This entrenched area occurs during the negative phase of a phenomenon
known as the ?Arctic Oscillation? (AO). So while a significant portion of the
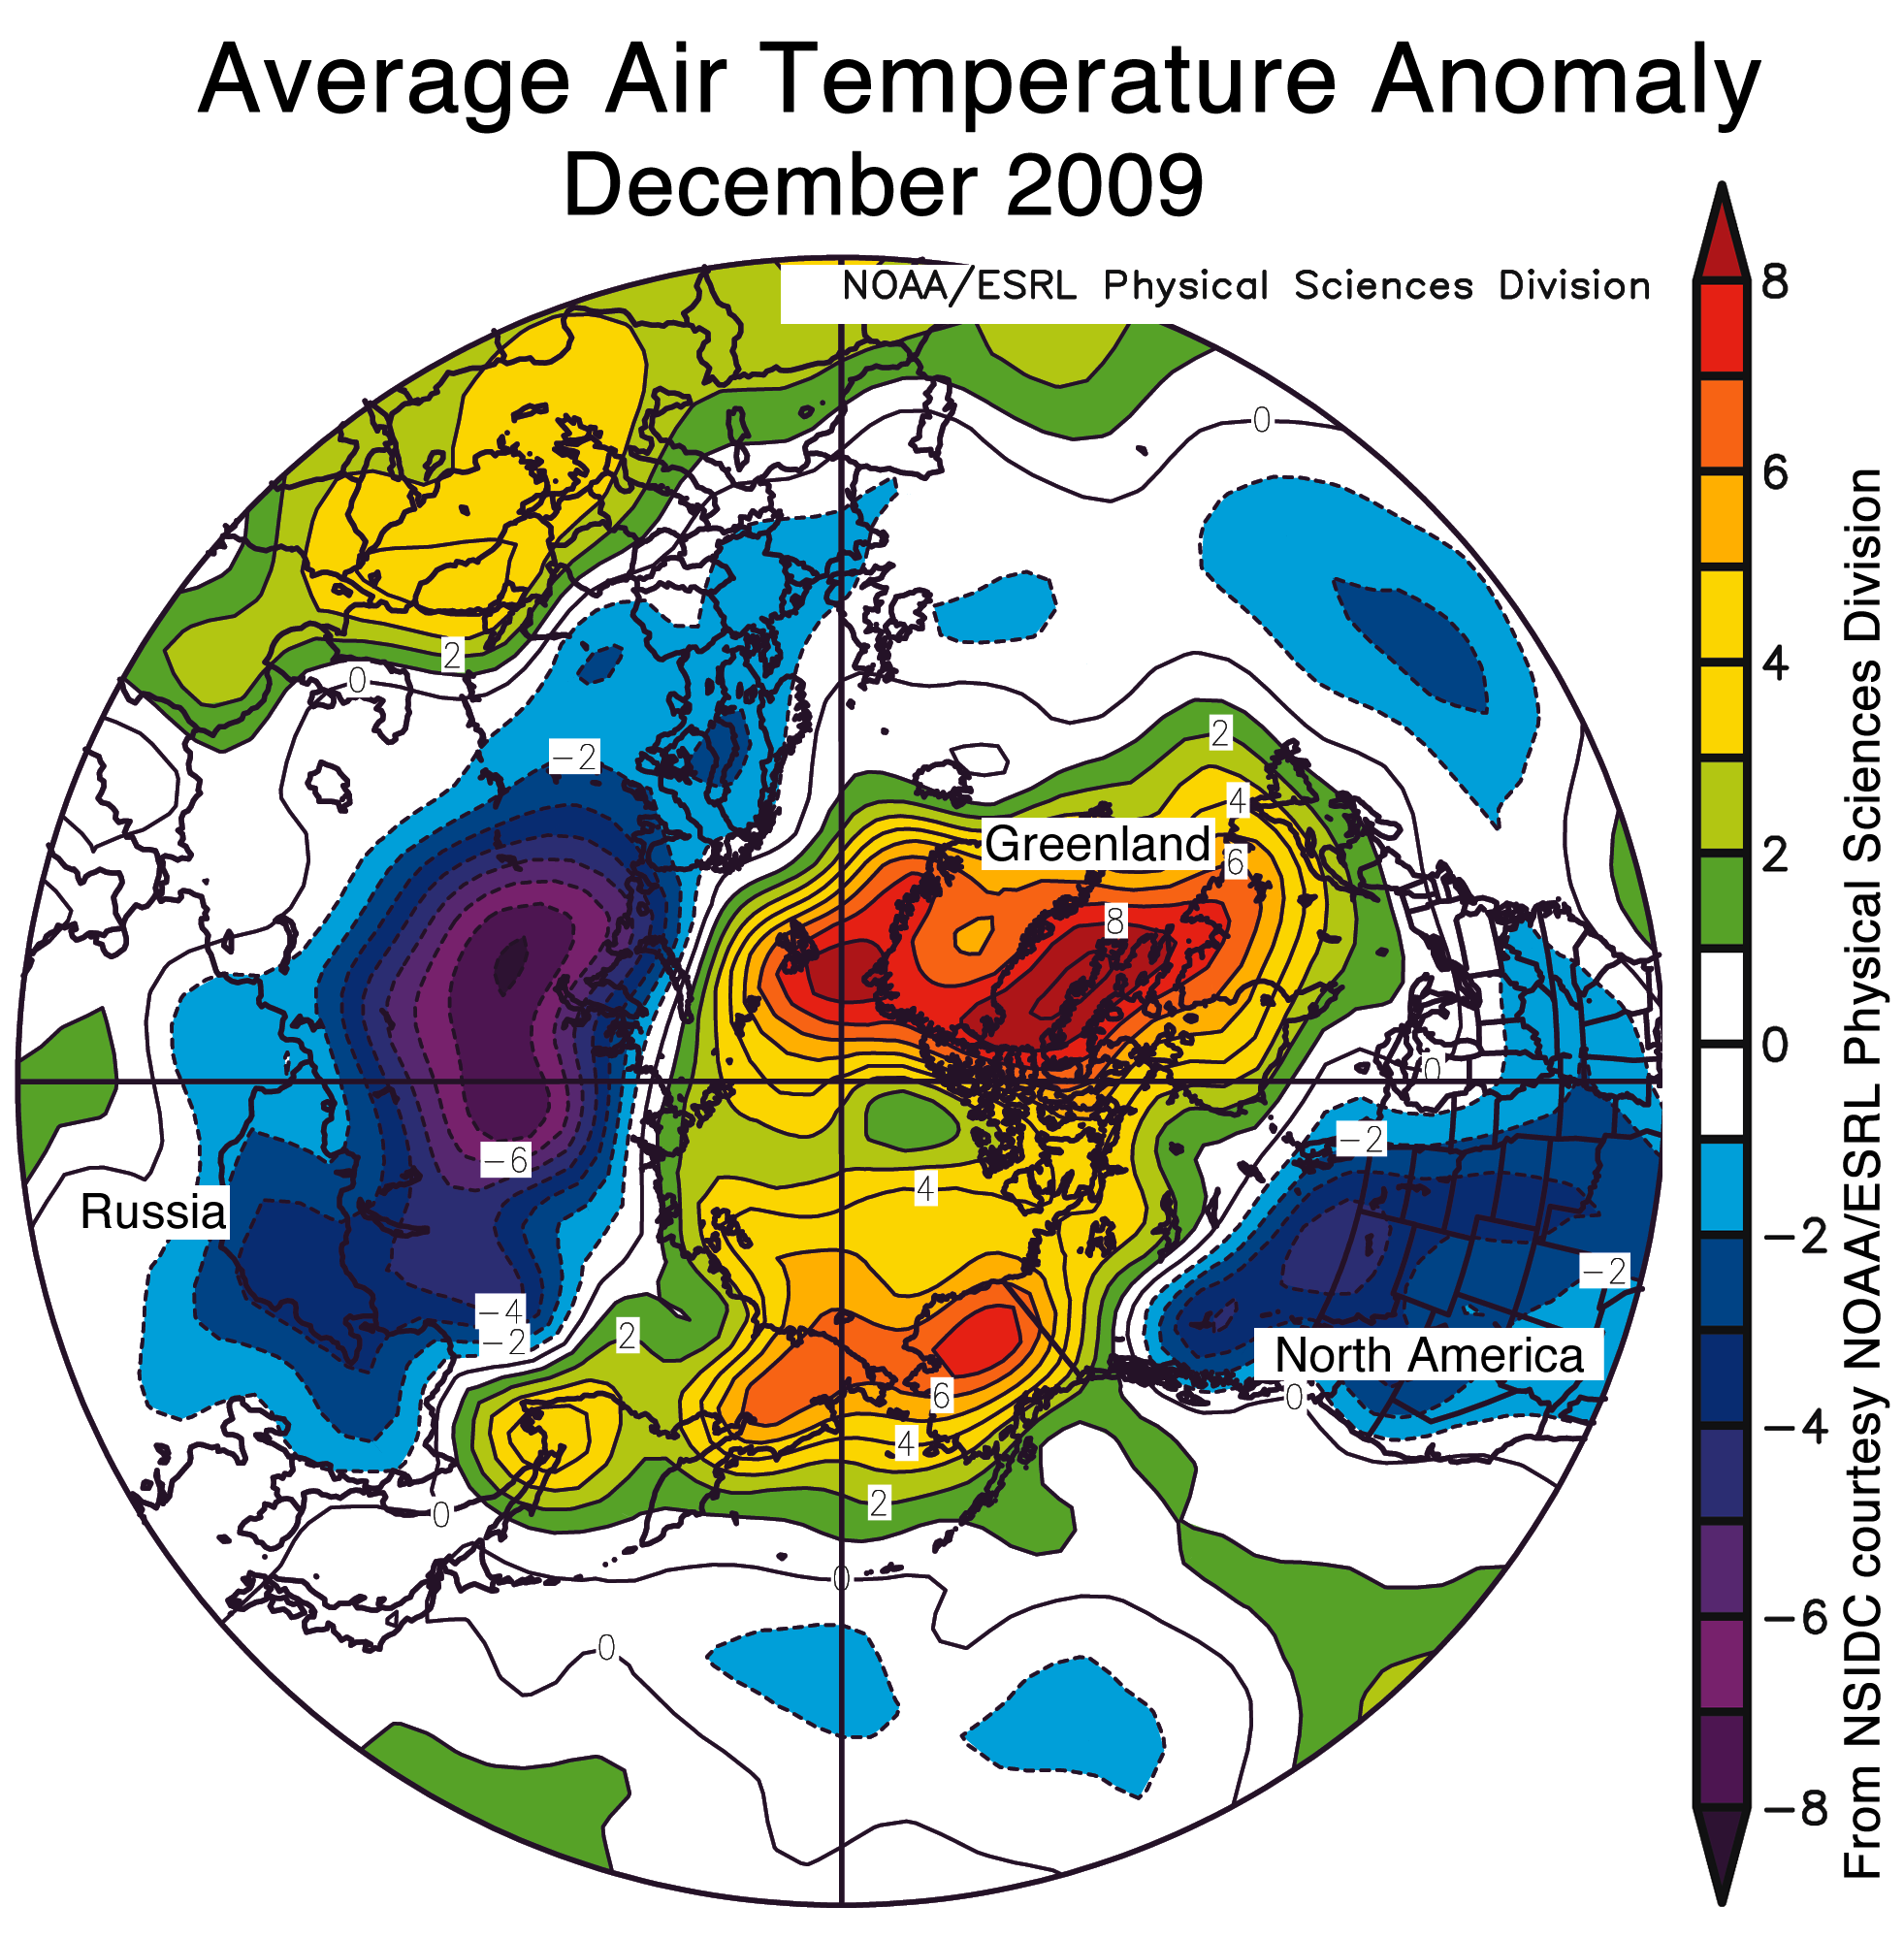
Northern Hemisphere has been experiencing historic cold this winter, polar
temperatures are up to 15 degrees above normal. The temperature and pressure
anomalies can be seen in the figures below.
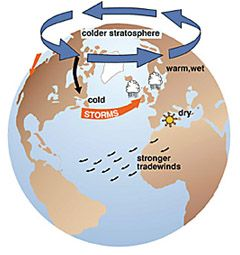
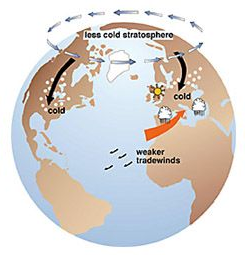
When the AO is in negative phase, higher pressure over the pole combines with
lower pressure over the midlatitudes to steer cold air and storms farther into
the interior of North America. You can see the effects of both phases in these
figures from the National Snow and Ice Data Center.
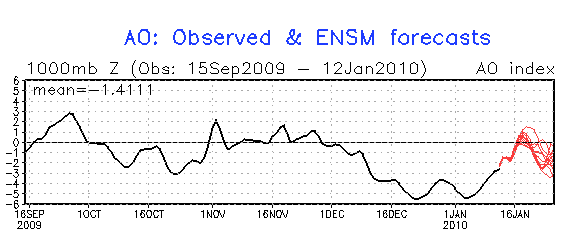
The values for the AO during December and January, as calculated by the Climate
Prediction Center (CPC), were the most negative since record keeping began in
1950. The duration of the extreme negative value was also somewhat unusual.
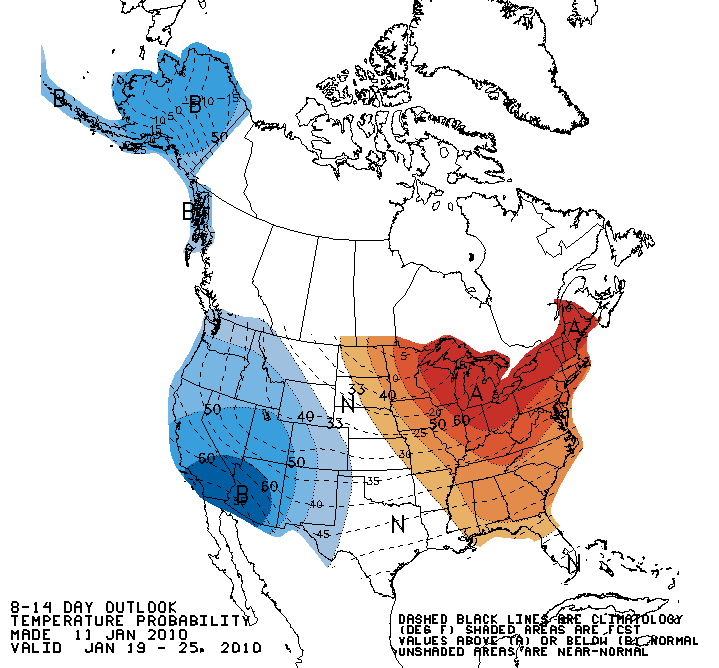
As the negative AO phase began to moderate this week, the correlated extreme
cold outbreaks began to diminish as well. This pattern disrupted the effects
of the moderate El Nino found in the equatorial south pacific. The normal
pattern for the U.S. during an El Nino would have been warmer weather in the
northern areas of the country and cooler along the Gulf Coast instead of the
widespread cold seen over most of the U.S. Shorter-range outlooks from CPC
now reflect weather for the eastern U.S. no longer dominated by cold air
outbreaks.
Gary McManus
Associate State Climatologist
Oklahoma Climatological Survey
(405) 325-2253
January 12 in Mesonet History
| Record | Value | Station | Year |
|---|---|---|---|
| Maximum Temperature | 80°F | BURN | 2000 |
| Minimum Temperature | -1°F | NEWK | 2011 |
| Maximum Rainfall | 2.10″ | DURA | 2007 |
Mesonet records begin in 1994.
Search by Date
If you're a bit off, don't worry, because just like horseshoes, “almost” counts on the Ticker website!