Ticker for January 23, 2009
MESONET TICKER ... MESONET TICKER ... MESONET TICKER ... MESONET TICKER ...
January 23, 2009 January 23, 2009 January 23, 2009 January 23, 2009
This Ticker is Off the Charts!
An amazing Oklahoma weather day unfolded yesterday. This week,
we've been concerned with emergent drought. On Thursday, the
incipient dryness took a back seat (but a critical supporting role)
to some amazing atmospheric feats.
Before Thursday, the record for daily temperature range during
the Mesonet Era (1994-) belonged to Mangum, which reached 77.11 F
on December 27, 1996, after beginning the day at 17.02, a range
of 60.09 degrees Fahrenheit. On Thursday, that record was broken
by TWO Mesonet stations:
#1: Chickasha: 18.39F to 79.50F (61.11 degrees range)
#2: Burneyville: 20.31F to 80.85F (60.54 degrees range)
Two other stations placed themselves in the Mesonet's all-time top
ten for range yesterday:
#8: Okmulgee: 17.24F to 76.75F (59.51 degrees range)
#8: Bristow: 16.90F to 76.41F (59.51 degrees range)
For the record, here's the in and out on the highs and lows from
Thursday:
Now, how did such a huge temperature range happen? The first
contributor was a very, very very (did we say "very"?) shallow
morningtime layer of cold air: the famous "morning inversion":
The red trace on the right shows the temperatures observed as a
radiosonde ("weather balloon", in English) rose through the
atmosphere. Temperature is plotted (more or less) from left to
right on this graph, so the further rightward the temperature trace,
the warmer the temperature. You can see that temps were quite cool
(toward the left) near the surface, but as soon as the balloon got
a few hundred feet into the atmosphere, the temperature rose
rapidly!
What this means, on a sunny day, even a January sunny day, is that
the Sun doesn't have to work very hard to heat up that little cold
sliver of atmosphere.
And that's only half the story.
See the green line on the left? That's the dewpoint temperature,
or moisture content, as you go up in the atmosphere. Right means
more moisture, left means less. The dewpoint above Norman was dry.
Off-the-charts dry. We mean LITERALLY off the chart! Drier air
heats more quickly than moist air, and that helped out too.
But that's not all. Meteorologist Andy Dean from the Storm
Prediction Center tells us that the cumulative sum of moisture from
bottom to top (precipitable water, if you're scoring at home) was
the SECOND DRIEST in the last 20 years, out-parched only by the
morning of March 3rd, 2002.
Strange Goings-On at Chickasha
Speaking of Chickasha, it wasn't content to set the all-time range
record. It had to go and be weird in the process. Former Mesonet
student employee Eric Hunt brought to our attention a strange
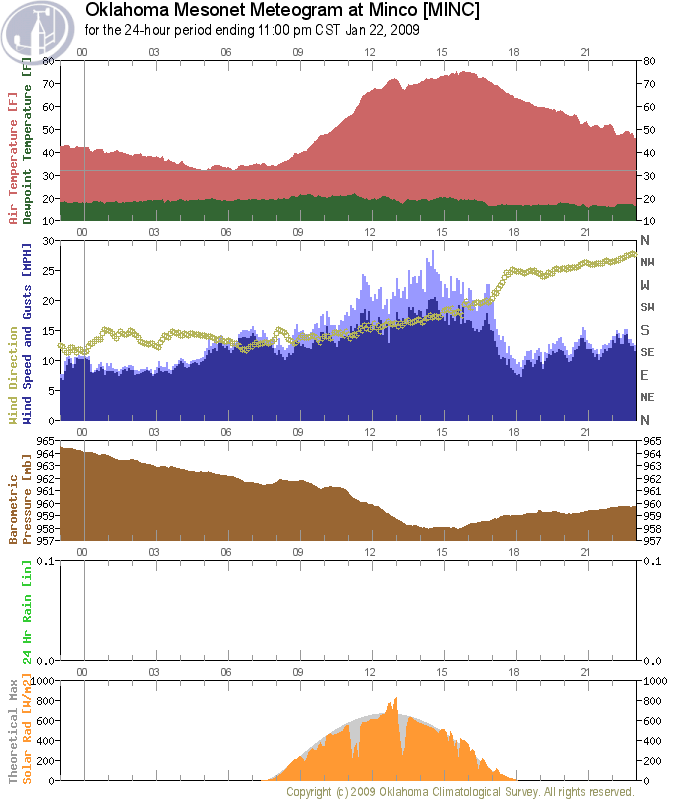
feature on the Chickasha meteogram:
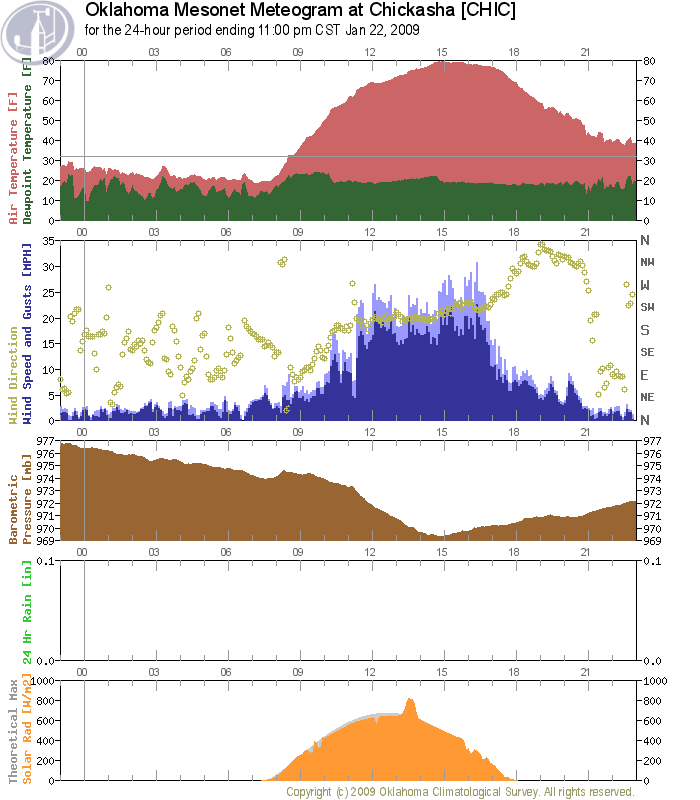
Notice the weird bubble of enhanced solar radiation (orange trace) at
about 1:30 pm? We asked Mesonet Quality Assurance Meteorologist
Cindy Morgan about it, and before the conversation was over, we found
the same feature at Ninnekah and (about 30 minutes earlier) Minco:
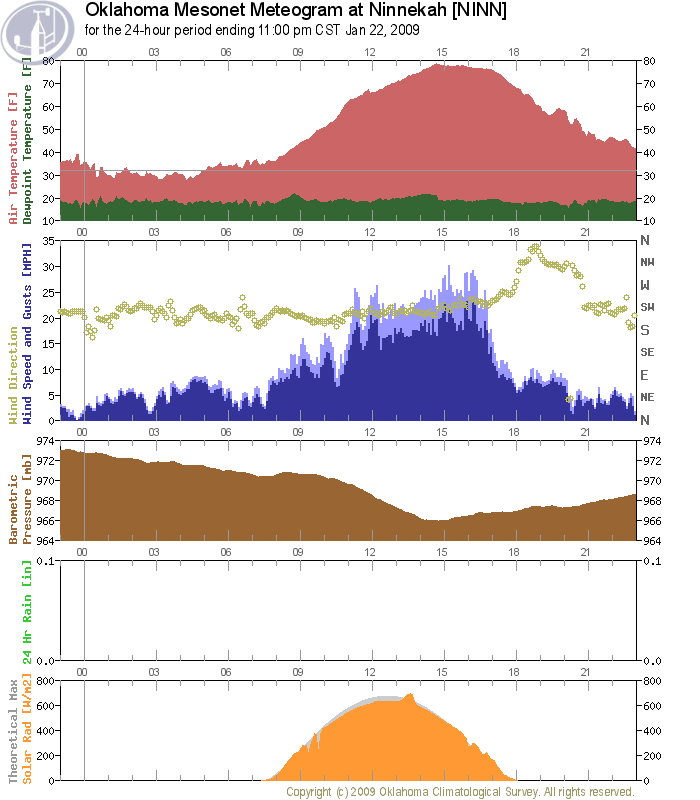
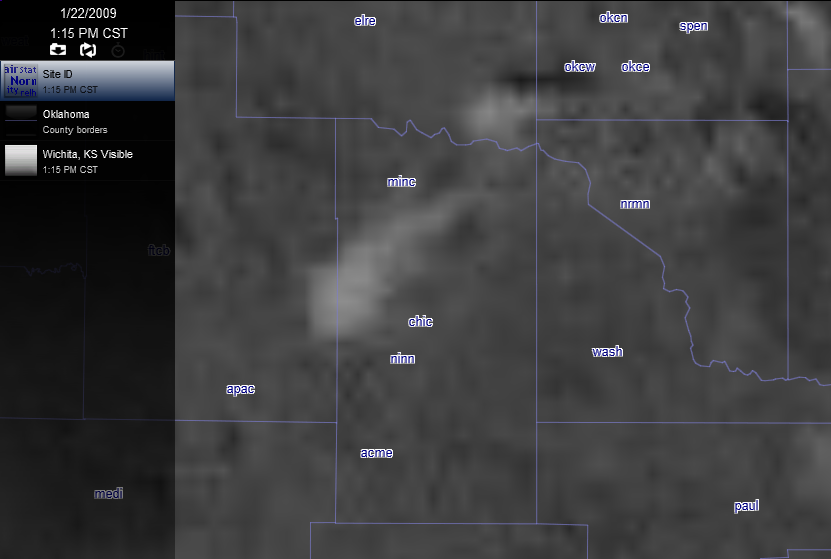
What was the culprit? Sunlight reflected off of - get this - a lonely
cloud feature passing just north of the stations, Minco at about 1 pm,
and the other stations 30 minutes later. It can be seen in this 1:15
satellite image as the bright feature just northwest of Chickasha:
Can you believe it? On one of the driest days EVER in the state's
history, we get something interesting from a CLOUD?
January 23 in Mesonet History
| Record | Value | Station | Year |
|---|---|---|---|
| Maximum Temperature | 78°F | WEBB | 2002 |
| Minimum Temperature | -3°F | HOOK | 2014 |
| Maximum Rainfall | 1.90 inches | STIG | 2002 |
Mesonet records begin in 1994.
Search by Date
If you're a bit off, don't worry, because just like horseshoes, “almost” counts on the Ticker website!