Ticker for July 3, 2008
MESONET TICKER ... MESONET TICKER ... MESONET TICKER ... MESONET TICKER ...
July 3, 2008 July 3, 2008 July 3, 2008 July 3, 2008
Climate Change, Urbanization and Other Esoteric Dinner Topics
A response to yesterday's Ticker has several very good (and
relevant) questions (we added the [X] tags):
Mr. Ticker,
I read with interest your excellent Oklahoma climate overview.
A question occurs to me regarding 30-year averages, and the
current subject of global warming. What does a graph look like
which depicts rolling 30-year average temperatures? [A] One
would assume 'upward to the right', correct?
Also, [B] what affect does local heat islands have on climate data,
as opposed to the less asphalt and concrete influenced numbers of
times past? [C] The rural disposition of the mesonet is good.
[D] Enjoy your emails,
Thanks for the questions. Here are some responses.
A. (increasing temps, right?) Well, it actually depends on who you
ask, when you ask, how you ask and where you ask. For example,
folks in the inter-mountain west have experienced profound and
unprecedented warmth for several decades:
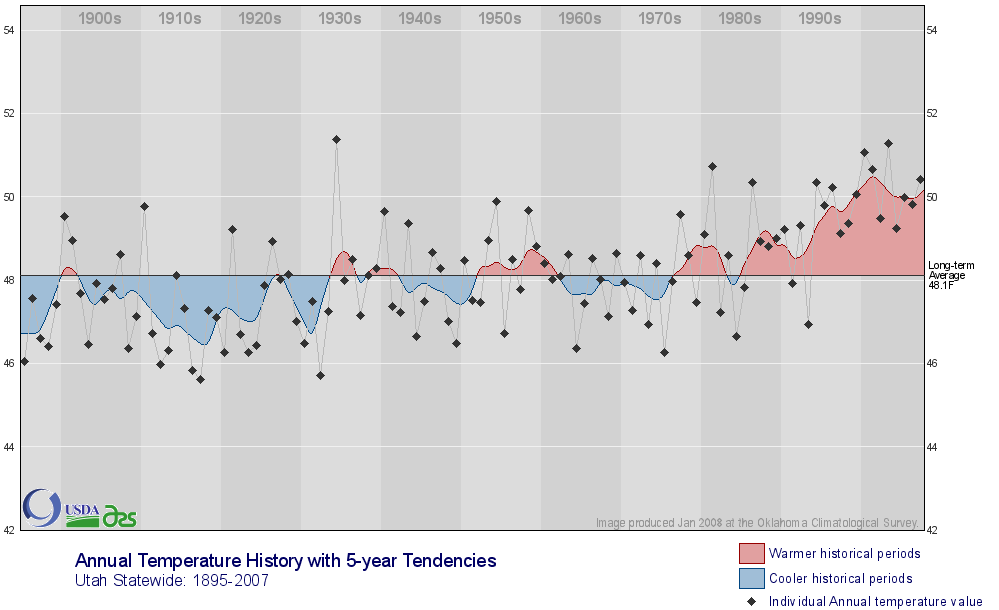
(this image shows annual temperatures [diamonds] for the
state of Utah, with a five-year filter [color] set against
the long-term average)
On the other hand, folks in Dixie have seen considerable, uh,
coolth during most of that span, with a short burst of relative
warmth in the last couple of years:
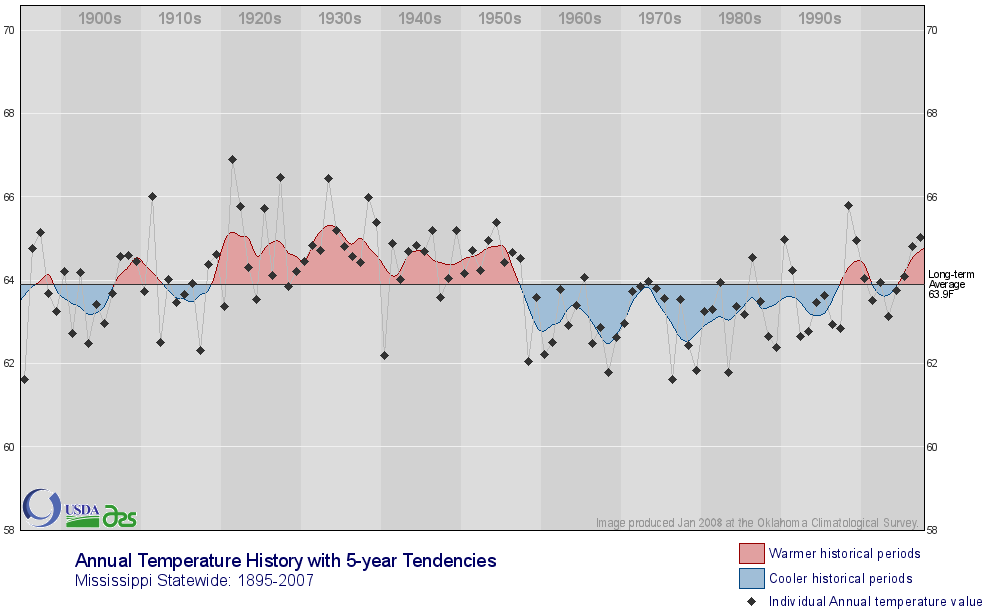
Drawing focus in on Oklahoma, differences between places persist
when comparing the panhandle (OK1) with the southeast (OK9):
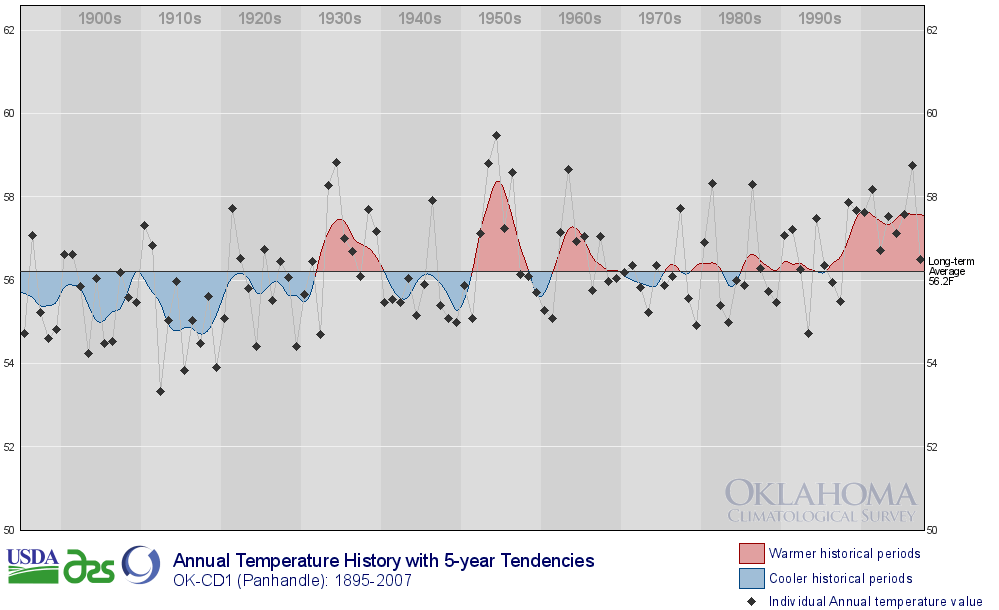
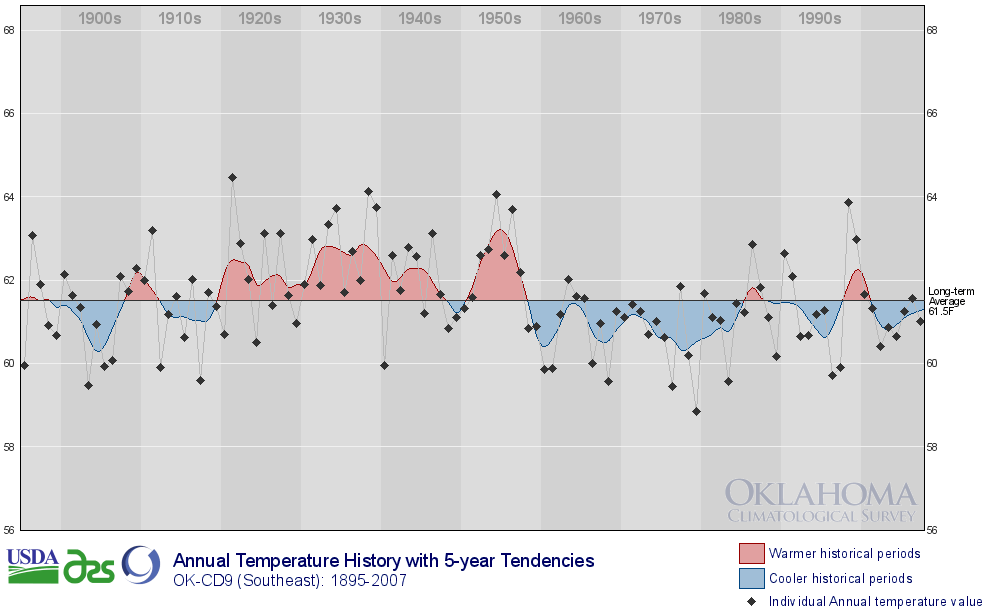
Now, we should point out a few things before we go too far. First
of all, the pattern isn't random, as our arguments above may
indicate. Most of the U.S. has warmed, the Western third has done
so dramatically. Parts of the southeast have not warmed
considerably, and Oklahoma's situation kinda-sorta reflects some
transition between these regimes.
But, and this is important, annual warming isn't spread uniformly
across the calendar. There are differences between months and
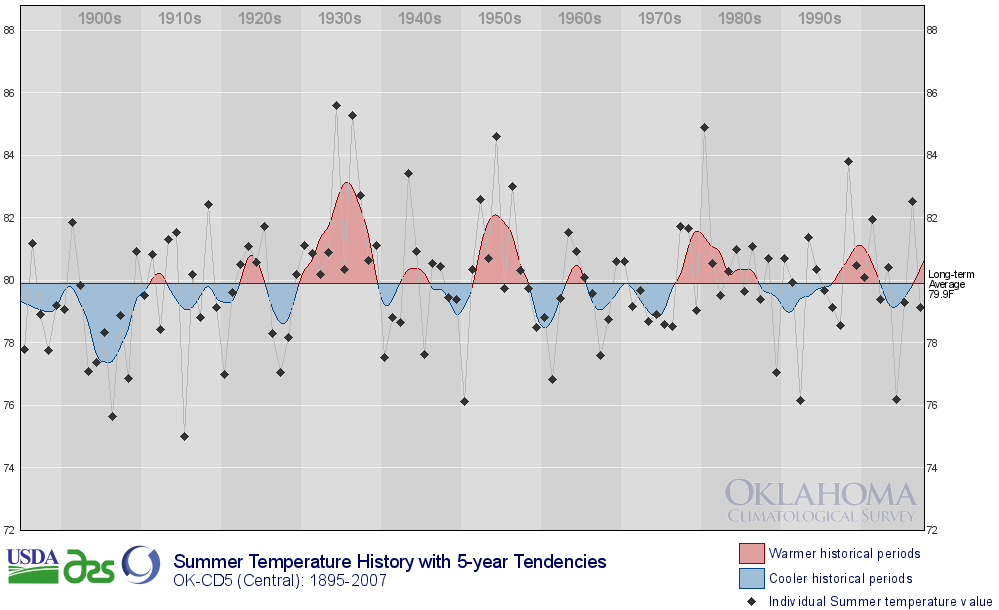
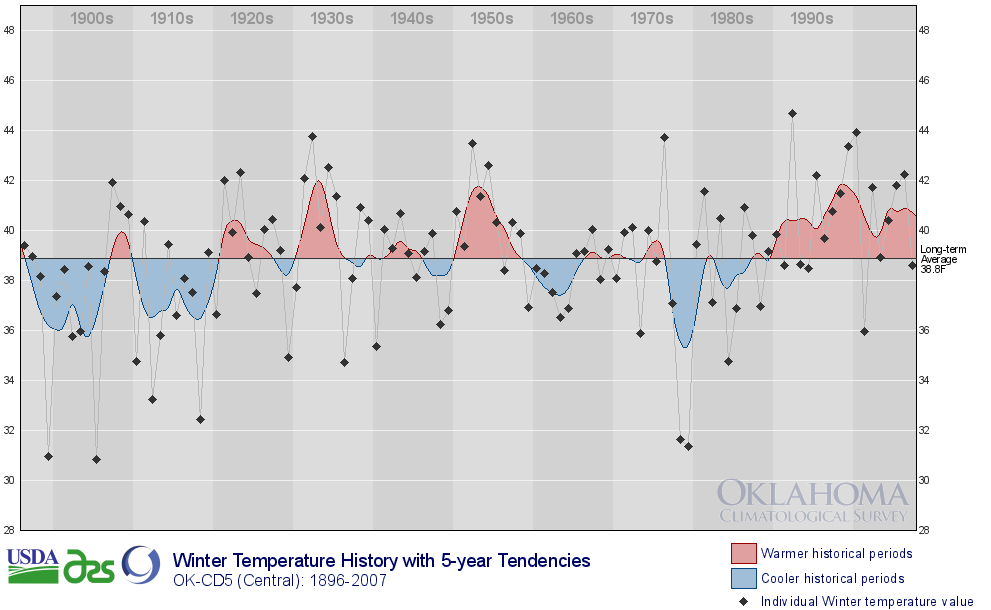
seasons as well. Here in central Oklahoma (gosh, we're provincial),
we've warmed somewhat, but we all almost all of our annual warming
to the winter and early spring months, while our summer and autumn
seasons are pretty much flat:
So what does this mean in the overarching Grand Narrative of
climate change? Well, a little bit. Most climate folks are quick
to remind that regional and decadal and seasonal variability (in
other words, most of the stuff shown above) will still play a
major role in future climates.
B.(urbanization) Yes, urbanization can make an impact on climate
observations. Take a look at Southern Nevada's temperature trace:
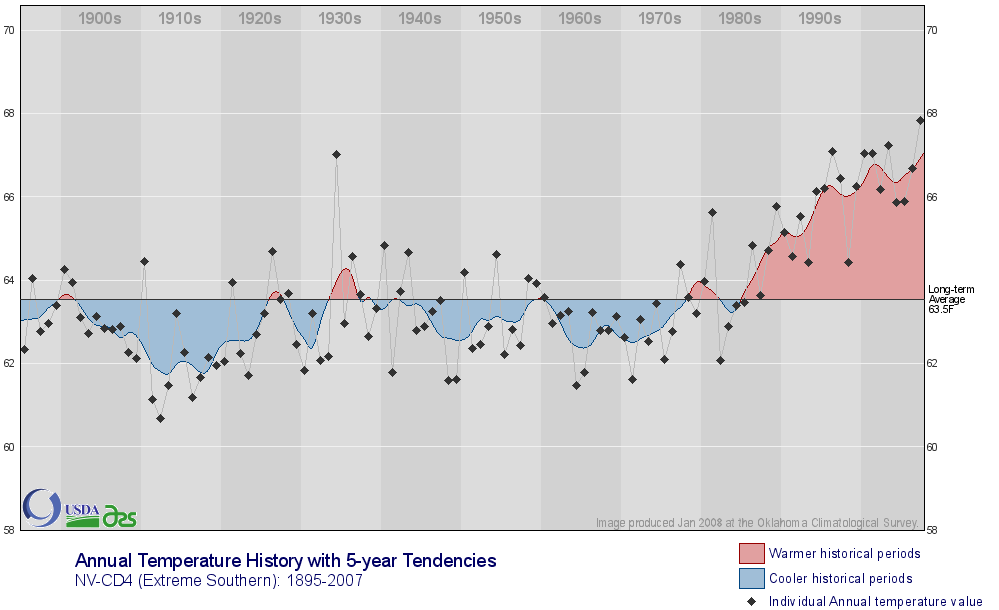
Now, most of the stations that went into this trace are near an
exploding metropolitan area, and can probably hear Tom Jones ask
them to tip their waitress each night. Considering this, it might
make us justifiably skeptical of the trace.
However, the good news is that this effect is well-documented and
is strongly considered in datasets. Also, like any good detective
work, corroborating evidence comes into play, such as (extremely
rural) Northwest Arizona:
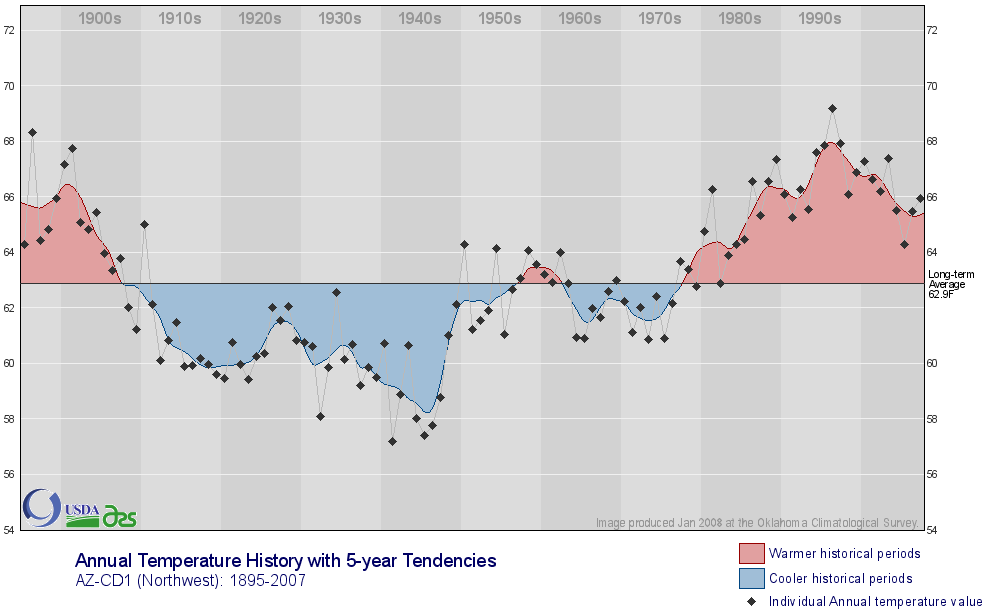
Now, these stations could care less about Tom Jones. They probably
listen to Merle, like any good American. But, their extreme
warming tends to corroborate and support what is seen in southern
Nevada.
C.(hooray Mesonet). Yes, Mesonet stations were very carefully sited
and undergo constant attention for drift and bias. It is a weather
network whose climate importance increases with each month's
pristine dataset.
D. (enjoys Ticker) Aw, shucks.
July 3 in Mesonet History
| Record | Value | Station | Year |
|---|---|---|---|
| Maximum Temperature | 106°F | KIN2 | 2011 |
| Minimum Temperature | 49°F | VINI | 2014 |
| Maximum Rainfall | 6.39″ | NOWA | 2016 |
Mesonet records begin in 1994.
Search by Date
If you're a bit off, don't worry, because just like horseshoes, “almost” counts on the Ticker website!