Ticker for April 6, 2005
MESONET TICKER ... MESONET TICKER ... MESONET TICKER ... MESONET TICKER ...
April 6, 2005      April 6, 2005      April 6, 2005      April 6, 2005


Lots to Look At

Tuesday was a synoptically-active day on the southern plains as the
upper parts of the atmosphere geared up for severe weather early.
After some early-afternoon hesitation, surface conditions got in on
the act by pulling copious moisture into eastern Oklahoma, where
severe thunderstorms with very large hail fired along the dryline.

An interesting sequence of events, to be sure. But that which was
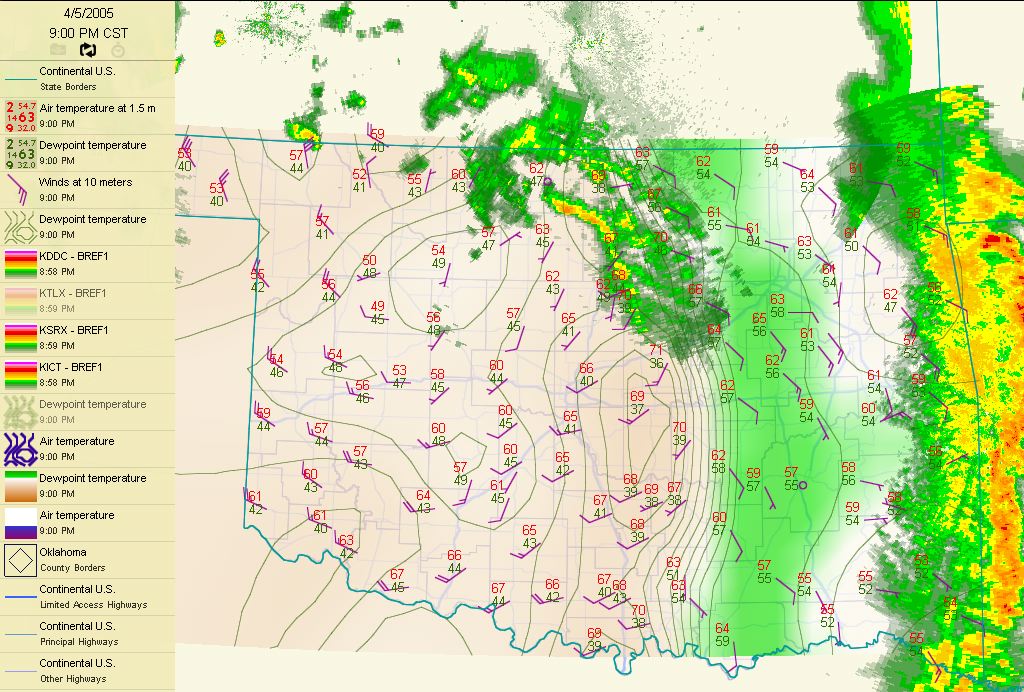
left behind at 9:00 pm is also very complex and interesting:


This map carries some very interesting features that are directly
and indirectly related to the day's action. These features are
diverse enough to tickle the interests of just about any weather
fan, from the strict synoptician to the devoted dynamicist to the
loyal land-atmospherist. To wit:

1. One testament to the strong dynamic forces that drove today's
storm system were the *very* strong straight-line winds that
raked the panhandle behind the attendant cold front. Several
gusts above 60 mph were measured.

2. The 9pm map shows the state's driest air not in the panhandle or
west, as one might expect, but right smack dab in central Oklahoma.
The synoptic-scale surface system (try saying that ten times quickly)
wrapped up dramatically, pulling the driest air snugly up against
the surface low in north-central Oklahoma.

3. On the other hand, the state's most moist air (shown in green tint)
draped eastern Oklahoma in a rather curious north-south belt. In
this belt, clearing skies gave the sun just enough time to evaporate
some of the water left by the rapidly-exiting squall line.

4. Finally, a subtle feature shows up across west-central Oklahoma -
a relative maximum in the dew point field (green contours). This
feature testifies to several components of the day's action. The
synoptic wrapping mentioned earlier certainly pulled some moisture
all the way around the surface low, but that's not all. The
dynamics and structure of the middle and upper atmosphere were so
strong that convective development occurred several places behind
the dry air behind the dryline. Obviously, these storms weren't
surface-based, and much of the precipitation was lost to
evaporation before it hit the ground. However, the evaporative
effects can be seen in the 9pm map as cooler and more moist air
across much of western Oklahoma.
April 6 in Mesonet History
| Record | Value | Station | Year |
|---|---|---|---|
| Maximum Temperature | 100°F | WALT | 2011 |
| Minimum Temperature | 14°F | EVAX | 2023 |
| Maximum Rainfall | 3.57″ | OKMU | 2018 |
Mesonet records begin in 1994.
Search by Date
If you're a bit off, don't worry, because just like horseshoes, “almost” counts on the Ticker website!