Ticker for November 8, 2002
MESONET TICKER ... MESONET TICKER ... MESONET TICKER ... MESONET TICKER ...
November 8, 2002 November 8, 2002 November 8, 2002 November 8, 2002
Mother Nature 1, Technology 0
The last three weeks of absurdly cloudy weather didn't just affect
human job performance. Some satellites also found it tough to
do their chores, thanks to the dreary weather.
One suite of products generated by Advanced Very-High Resolution
Radiometer (AVHRR - and the acronyms are only getting started)
satellites is the Normalized Difference Vegetation Index (NDVI).
One of the NDVI products is visual greenness (VG), which can loosely
be described as the amount of certain greenish colors seen by a
green-sensitive eyeball in the sky.
Anyway, the VG products aren't just a snapshot, but a weekly composite
of several satellite passes. The final result of a week during early
October can be seen here:
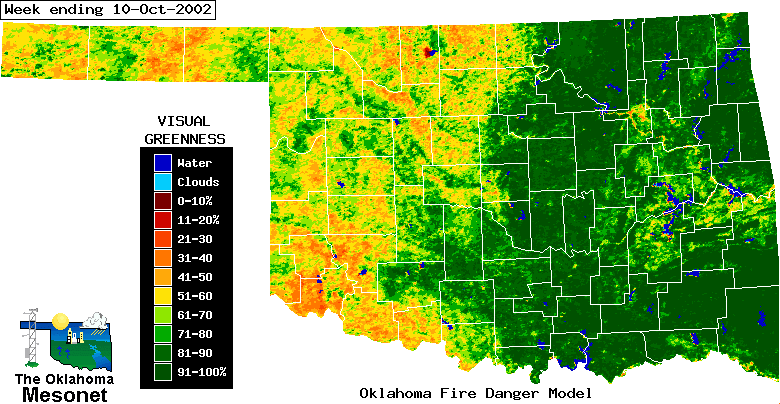
This map shows green conditions in eastern Oklahoma, and relatively
non-green conditions in western Oklahoma. And this makes sense,
considering the recent drought across western Oklahoma, and the fact
that wheat fields are prepared in early autumn.
Check out the next week's VG map:
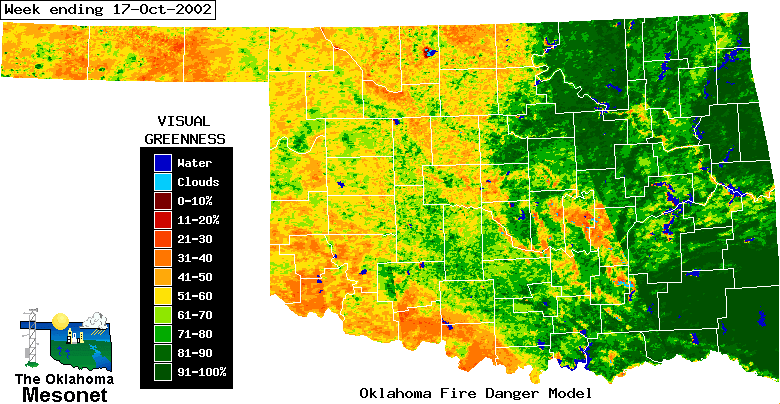
Sharp, perfectly straight lines usually don't happen in nature.
So, that northwest-to-southeast line near central Oklahoma is pretty
suspicious. Remember that these images are composited from several
satellite passes. That line is the blending in of a very green
pass across eastern Oklahoma late in the week (it rained early in the
week).
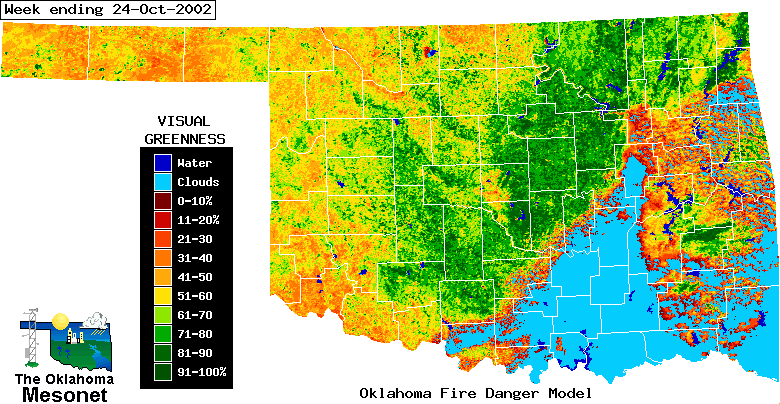
Then came the clouds.
When the satellite can't see the ground, it can't tell how green
stuff is. So, when clouds obscure the ground, the satellite's
output is "I don't know", as depicted on the next week's map:
and (horrors!) the next week's map:
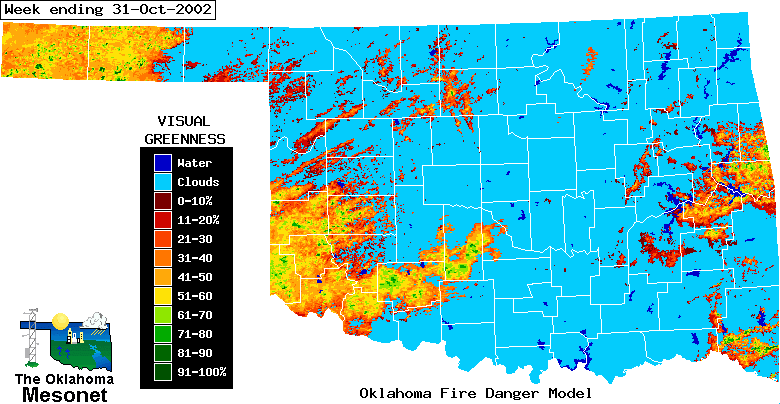
Notice, in the last map, that little bits of data creep through the
clouds. We all know that these weren't breaks in the clouds. So what
are they? They're an example of an imperfect cloud-recognition
algorithm. Combine these imperfections with the imperfections around
the cloudy area of the week before, and you've got a handful of
imperfection!
How does this have any impact on everyday life?
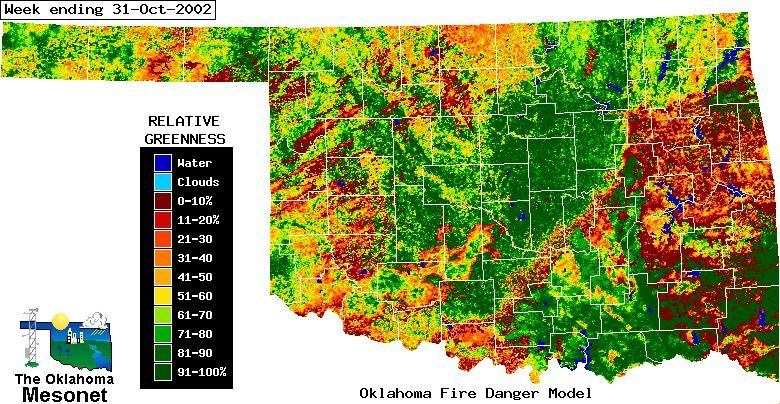
Well, when a product - say, the Oklahoma Fire Danger Model (OKFDM) -
uses greenness data to help assess fire conditions, these little
imperfections can result in a difficult-to-interpret assessment of
relative greenness (a derived product), as seen in the following map:
Thankfully, this sunny week will go a long way to resetting some of
those imperfections!
November 8 in Mesonet History
| Record | Value | Station | Year |
|---|---|---|---|
| Maximum Temperature | 92°F | FREE | 2006 |
| Minimum Temperature | 19°F | BOIS | 2000 |
| Maximum Rainfall | 3.96″ | TALI | 2011 |
Mesonet records begin in 1994.
Search by Date
If you're a bit off, don't worry, because just like horseshoes, “almost” counts on the Ticker website!