Ticker for January 3, 2002
MESONET TICKER ... MESONET TICKER ... MESONET TICKER ... MESONET TICKER ...
January 3, 2002    January 3, 2002    January 3, 2002    January 3, 2002


2001: Warmer than Normal for All Oklahomans, Drier for Most

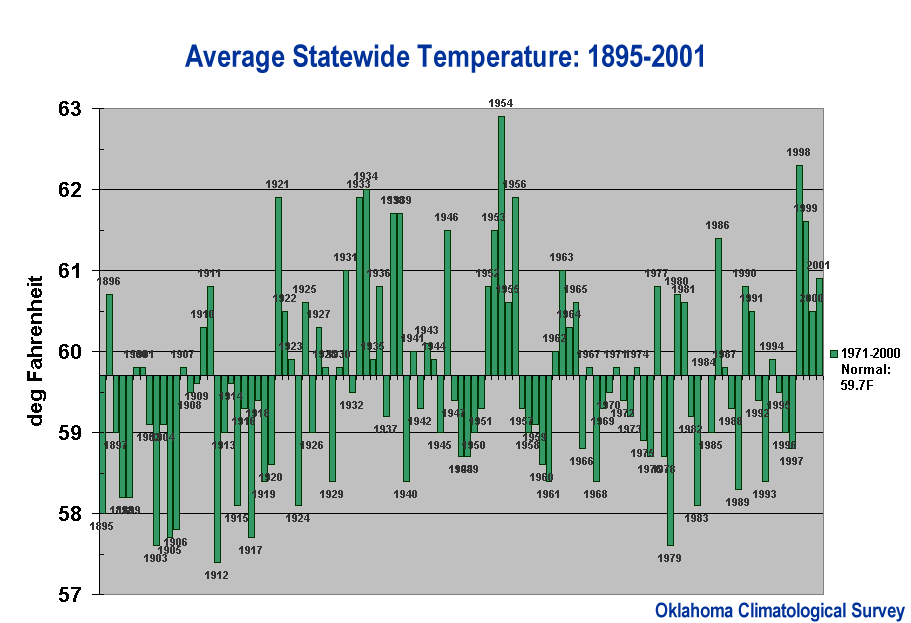
2001 was the fourth consecutive warmer-than-normal year for the state,
with the average temperature of 60.9 F ranking as the 15th warmest of
the 107 years since 1895.  The warmth (relative to normal, of course)
was greatest in northern portions of the state.  In fact, the panhandle's
average temperature of 58.5 F was its 6th warmest since 1895.


Overall, the year was relatively dry across the state.  This was
particularly true in northern and western Oklahoma.  The exceptions
to this rule were portions of eastern and southeastern Oklahoma, where
slightly above-normal precipitation was observed.

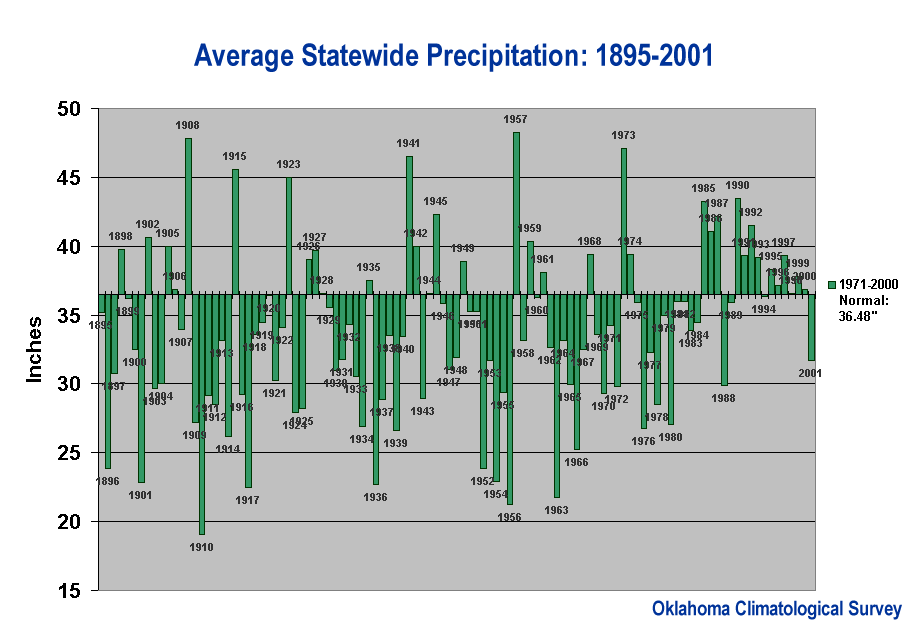
As noted in yesterday's Ticker, 2001 was the first year since 1988 with
statewide precipitation less than current normal values.  When the
normals are officially updated, 1989 and 1994 will slip below these
updated values.  We've taken the liberty to plot the rainfall against
the upcoming "new" normals in the following graphic.  Still, the trend
shows up dramatically:


Hidden in that graphic are some extremely dry short-term (a few months)
periods, notably winter and spring 1995-96, spring and summer 1998, and
summer 2000.  However, excessive rainfall in the months before and after
those dry spells produced above-normal totals for each calendar year.

The following tables show temperatures and precipitation versus the
"new" normals (1971-2000).


2001 PRECIPITATION DATA (inches)

Climate       Annual Precipitation    Rank*  Driest  Driest      Wettest
Division     2001   Norm  Depart Pct  of 107 Since   on Record   on Record

Panhandle   17.23  20.97  -3.74  82%   27th   1976    9.50 1910  33.25 1941
N. Central  22.21  32.01  -9.80  69%   15th   1976   14.50 1956  45.52 1957
Northeast   31.65  42.78 -11.13  74%   15th   1980   21.84 1963  60.49 1941

W. Central  21.57  29.03  -7.46  74%   19th   1984   10.30 1910  41.91 1997
Central     32.22  37.23  -5.01  87%   41st   1988   16.10 1910  50.56 1908
E. Central  46.26  45.83  +0.43 101%   70th   1999   23.15 1963  67.06 1973

Southwest   23.44  30.57  -7.13  77%   24th   1998   11.96 1910  44.05 1941
S. Central  38.79  39.68  -0.89  98%  t61st   1999   19.63 1963  57.51 1957
Southeast   53.69  50.78  +2.91 106%   80th   2000   27.48 1963  71.98 1990

Statewide   31.69  36.48  -4.79  87%  t38th   1988   19.05 1910  48.24 1957


2001 TEMPERATURE DATA (degrees Fahrenheit)

Climate      Annual Temperature    Rank*   Warmest  Coolest     Warmest
Division     2001   Norm  Depart   of 107  Since    on Record   on Record

Panhandle    58.5   56.4   +2.1      6th    1963    53.4 1912   59.5 1954
N. Central   59.9   58.5   +1.4     17th    1998    56.1 1979   62.2 1954
Northeast    60.8   59.0   +1.8     12th    1999    56.2 1917   62.4 1954

W. Central   60.3   58.8   +1.5     16th    1999   #56.6 1912   62.4 1954
Central      61.2   60.1   +1.1    t16th    1999    57.4 1912   63.1 1954
E. Central   61.6   60.4   +1.2    t19th    1999    58.1 1917  #63.4 1954

Southwest    61.9   61.0   +0.9    t21st    1999    58.8 1906   64.1 1954
S. Central   62.4   61.8   +0.6    t31st    2000   #59.8 1979   64.7 1954
Southeast    62.1   61.2   +0.9    t28th    1999    58.9 1979   64.5 1921

Statewide    60.9   59.7   +1.2     15th    1999    57.4 1912   62.9 1954

* - 1st   = Driest / Coolest      # - record has since been tied
107th = Wettest / Warmest         date given is year of first occurrence
January 3 in Mesonet History
| Record | Value | Station | Year |
|---|---|---|---|
| Maximum Temperature | 87°F | ALTU | 2006 |
| Minimum Temperature | -8°F | KENT | 2002 |
| Maximum Rainfall | 3.32″ | CENT | 2005 |
Mesonet records begin in 1994.
Search by Date
If you're a bit off, don't worry, because just like horseshoes, “almost” counts on the Ticker website!