Ticker for November 8, 2000
MESONET TICKER ... MESONET TICKER ... MESONET TICKER ... MESONET TICKER ...
November 8, 2000 November 8, 2000 November 8, 2000 November 8, 2000
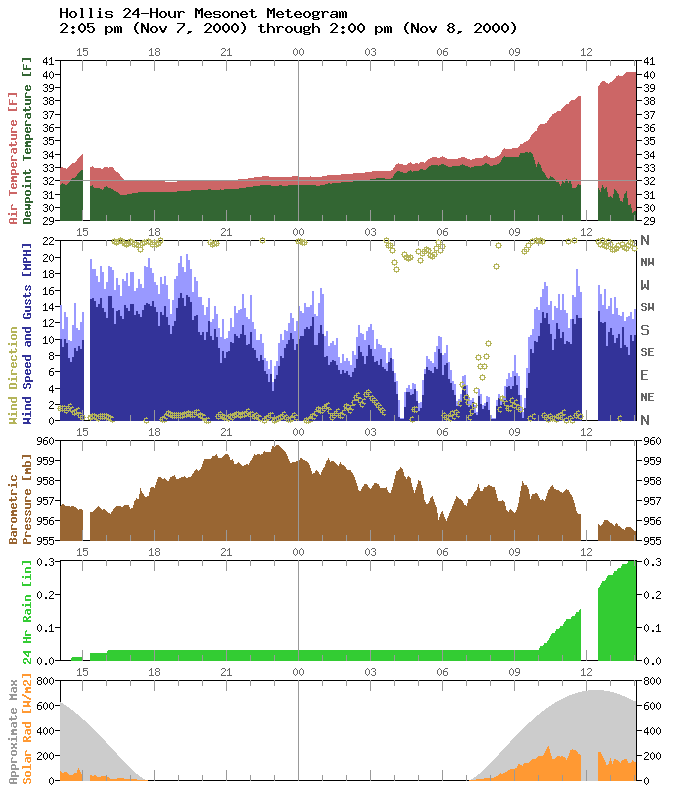
Snow Locks Temperature, Dewpoint Temperature near 32 F
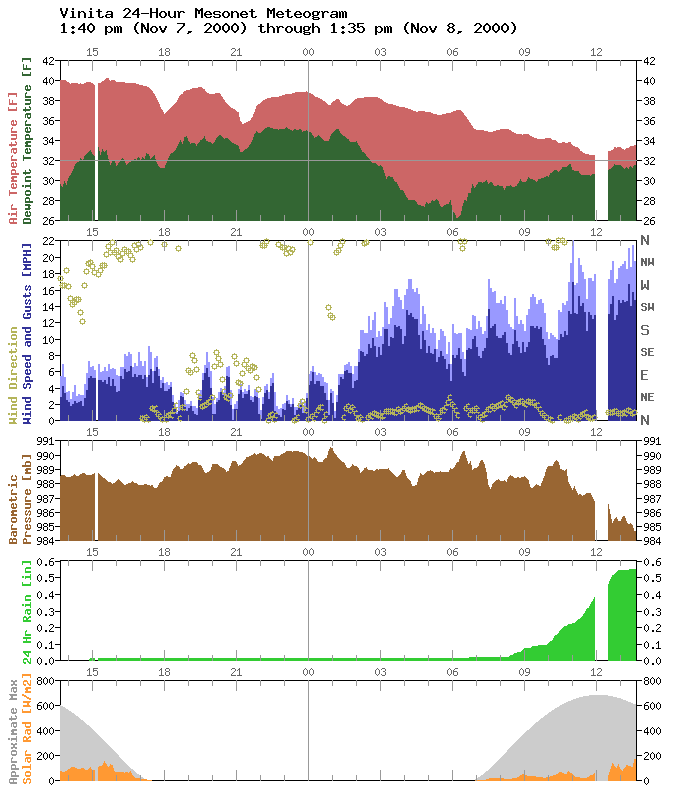
Today's meteograms show the effect of snowfall in central Oklahoma.
Before snow began falling at the following locations, temperatures
hovered in the upper 30s, but the falling snow modified the local
environment and locked temps and dew points near 32 F:
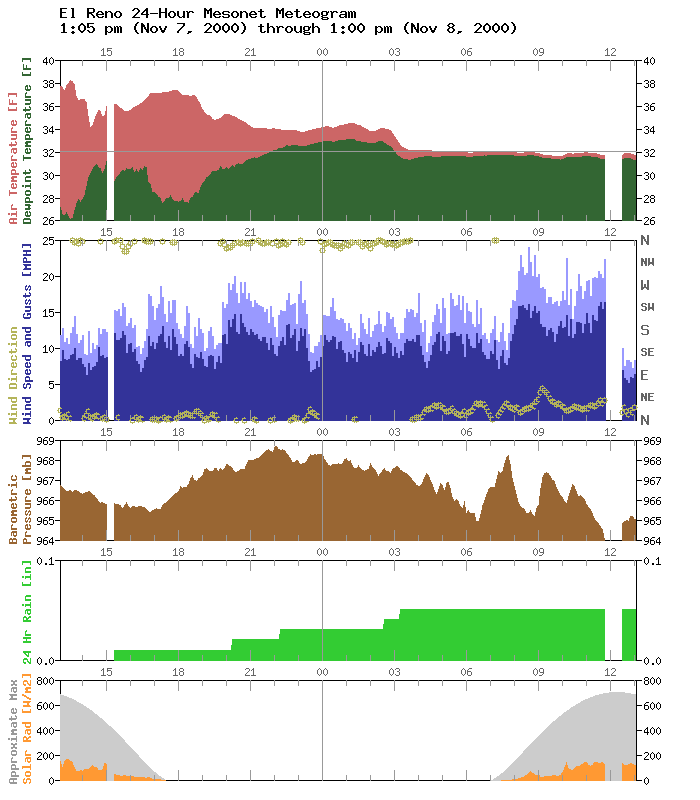
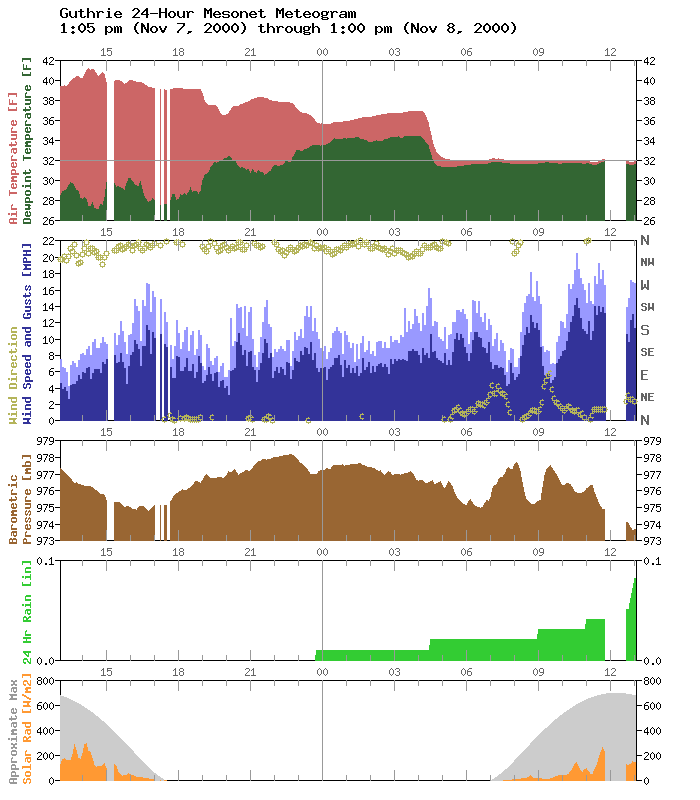
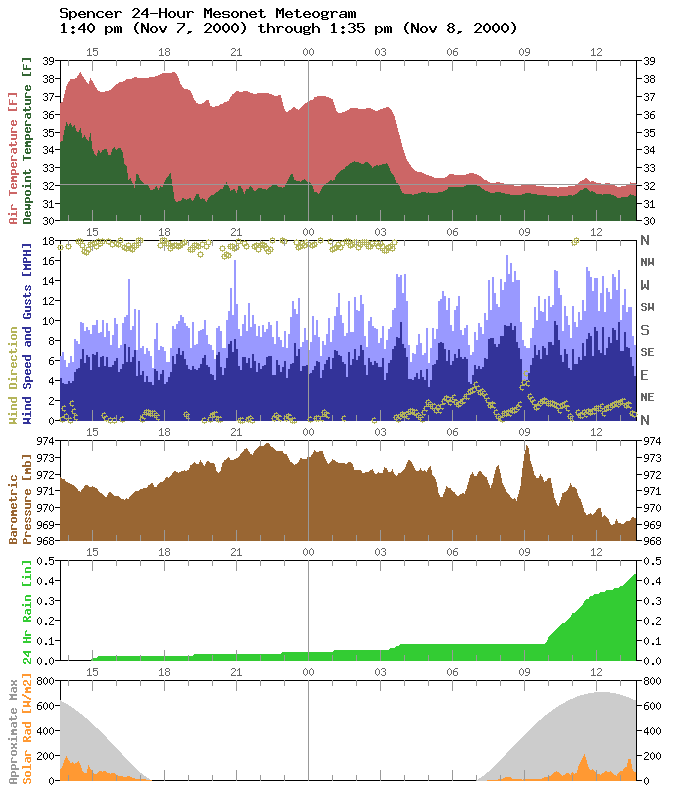
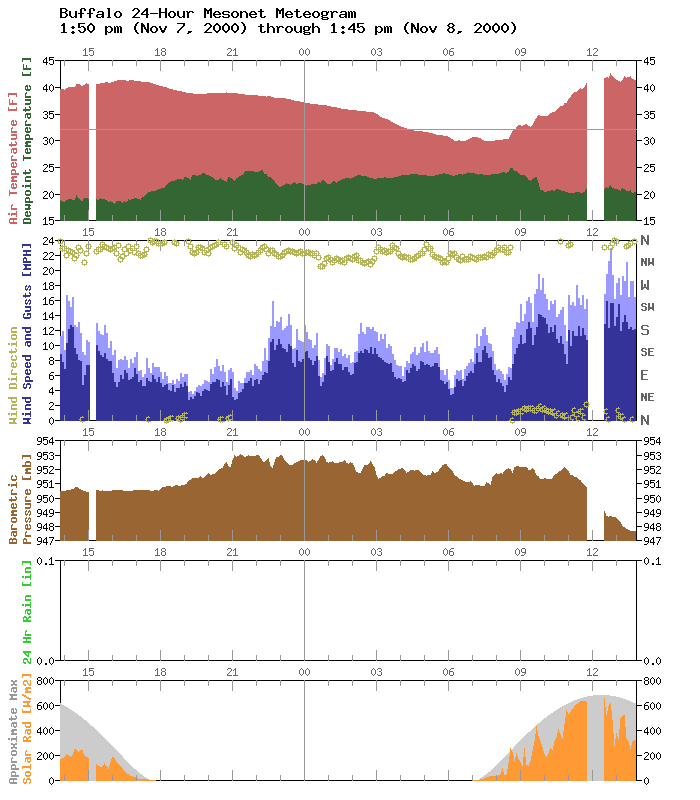
In the following locations, where little snow had fallen as of 2:30
this afternoon, temperatures showed a diferent behavior:
"Normal" June to Be Somewhat Wetter Across Majority of State
Oklahoma's "normal" June climate will be getting a makeover after
data from the 1991-2000 decade are processed. The normal monthly
temperatures and precipitation values are based on a 30-year average,
updated every ten years. In practice, this means that the 1991-2000
decade (the "nineties period") will be replacing the 1961-1970 ("the
sixties period") decade in the 30-year benchmark.
Preliminary data indicate that normal June monthly values will change
very little with the decade throughout the state. With the exception
of the panhandle, precipitation normals will be significantly greater
for most of Oklahoma.
Compared to the rest of the century, June months during the nineties
period were cooler than median statewide. However, due to a similar
cool decade of Junes during the sixties period, the normal
temperatures will change very little.
Normal June precipitation values will increase significantly across
the state, for two reasons. First, the nineties decade was quite wet
during June months. In fact, the north central, southwest and
southeast divisions appear to have observed their wettest decade of
Junes of the century. Second, the sixties period was quite dry and
June rainfall values during June were also low. The expiration of
these sixties values plus the incorporation of the wet nineties
values means greater normals across the state.
The exception to the overall rainfall scenario is the panhandle.
Climate regimes in this division can behave somewhat differently than
the majority of the state, and the month June during the 1960s was
certainly divergent from the rest of Oklahoma. In fact, June months
during the 1960s were the wettest such decade on record, and the
expiration of those dictate normal rainfall values in the panhandle
will be slightly less than current.
Related data is provided in the tables below. The first table
documents the prospective changes in "normal" June temperature values
for each of Oklahoma's nine climate divisions. The second is similar,
but for precipitation. The third provides a brief look at the apparent
historical standing of the Junes of the 1991-2000 decade.
Disclaimer: These are preliminary data for the state of Oklahoma
and the month of June only, and have not undergone extensive quality
control processing. The data are not necessarily indicative of results
outside Oklahoma. The data are not necessarily indicative of any
long-term trend in Oklahoma's climate, beyond natural interdecadal
variability.
PROSPECTIVE CHANGES IN MEAN JUNE TEMPERATURES (F)
------ Preliminary -----
Climate Current "New" Change
Division 61-70 71-80 81-90 Normals 91-00 Normals in Normals
Panhandle 74.0 75.3 74.1 74.5 74.5 74.4 -0.1 F
N. Central 76.5 77.4 76.9 76.9 76.2 76.8 -0.1 F
Northeast 75.3 75.8 75.9 75.7 75.6 75.8 +0.1 F
W. Central 76.1 77.2 76.2 76.5 76.1 76.5 0.0 F
Central 76.3 77.2 76.8 76.8 76.6 76.9 +0.1 F
E. Central 76.2 76.4 76.4 76.4 76.0 76.3 -0.1 F
Southwest 78.0 79.2 78.0 78.4 78.0 78.4 0.0 F
S. Central 77.3 78.1 77.3 77.6 77.7 77.7 +0.1 F
Southeast 76.3 76.4 76.5 76.4 76.3 76.4 0.0 F
Statewide 76.2 77.0 76.5 76.6 76.3 76.6 0.0 F
PROSPECTIVE CHANGES IN MEAN JUNE PRECIPITATION (in)
---------- Preliminary ---------
Climate Current "New" Change
Division 61-70 71-80 81-90 Normals 91-00 Normals in Normals
Panhandle 3.55 2.12 3.49 3.05 3.15 2.92 -0.13 (-4.3%)
N. Central 4.11 3.07 3.99 3.72 4.92 3.99 +0.27 (+7.3%)
Northeast 5.08 4.48 4.19 4.58 5.47 4.71 +0.13 (+2.8%)
W. Central 4.14 2.99 4.48 3.87 4.27 3.91 +0.04 (+1.0%)
Central 3.73 3.98 4.65 4.12 4.81 4.48 +0.36 (+8.7%)
E. Central 3.46 5.02 3.63 4.04 5.55 4.73 +0.69 (+17.1%)
Southwest 3.38 2.95 4.66 3.66 4.68 4.10 +0.44 (+12.0%)
S. Central 3.74 3.60 5.04 4.13 4.83 4.49 +0.36 (+8.7%)
Southeast 3.88 4.55 4.59 4.34 4.90 4.68 +0.34 (+7.8%)
Statewide 3.91 3.65 4.31 3.95 4.74 4.23 +0.28 (+7.1%)
1991-2000'S APPARENT STANDING AMONG THE MOST RECENT TEN DECADES
MEAN JUNE TEMPERATURE (F) MEAN JUNE PRECIP (in)
Climate 1991- Rank 1991- Rank
Division 2000 of 10 Warmest Coolest 2000 of 10 Wettest Driest
Panhandle 73.8 7th 76.4-50s 72.4-00s 3.15 4th 3.55-60s 2.12-70s
N. Central 76.2 9th 78.4-50s 75.3-00s 4.92 1st *4.12-50s 3.07-70s
Northeast 75.6 8th 77.4-30s 74.3-00s 5.47 3rd 6.09-40s 4.16-10s
W. Central 76.1 9th 78.4-50s 75.2-00s 4.27 2nd 4.48-80s 2.95-50s
Central 76.6 8th 78.2-30s 75.2-00s 4.81 2nd 5.30-40s 3.73-60s
E. Central 76.0 9th 77.8-50s 75.1-00s 5.55 2nd 6.39-40s 3.46-60s
Southwest 78.0 8th 80.2-50s 77.1-00s 4.68 1st *4.66-80s 2.95-70s
S. Central 77.7 7th 79.3-50s 76.8-00s 4.83 3rd 5.08-40s 3.41-10s
Southeast 76.3 8th 78.1-50s 76.1-00s 4.90 1st *4.63-40s 3.61-50s
KEY: 1st = warmest or wettest of ten decades starting with 1901-1910
10th = coolest or driest and ending with 1991-2000
"50s" indicates 1951-1960 decade, etc.
* - previous record
November 8 in Mesonet History
| Record | Value | Station | Year |
|---|---|---|---|
| Maximum Temperature | 92°F | FREE | 2006 |
| Minimum Temperature | 19°F | BOIS | 2000 |
| Maximum Rainfall | 3.96″ | TALI | 2011 |
Mesonet records begin in 1994.
Search by Date
If you're a bit off, don't worry, because just like horseshoes, “almost” counts on the Ticker website!