Ticker for November 9, 2011
MESONET TICKER ... MESONET TICKER ... MESONET TICKER ... MESONET TICKER ...
November 9, 2011 November 9, 2011 November 9, 2011 November 9, 2011
2011: A Year of Extremes
The addition of earthquakes to Oklahoma's natural calamities has certainly
peaked a lot of interest in just how nasty 2011 has been. Personally, I think
Mother Nature jumped the shark with the earthquakes. Heck, even Evita Peron is
begging people to cry for Oklahoma at this point. So sit down, grab a cup of
coffee and attempt to get through this overly wordy and overtly dramatic review
of Oklahoma's weather thus far in 2011. Such un-fond memories to be had!
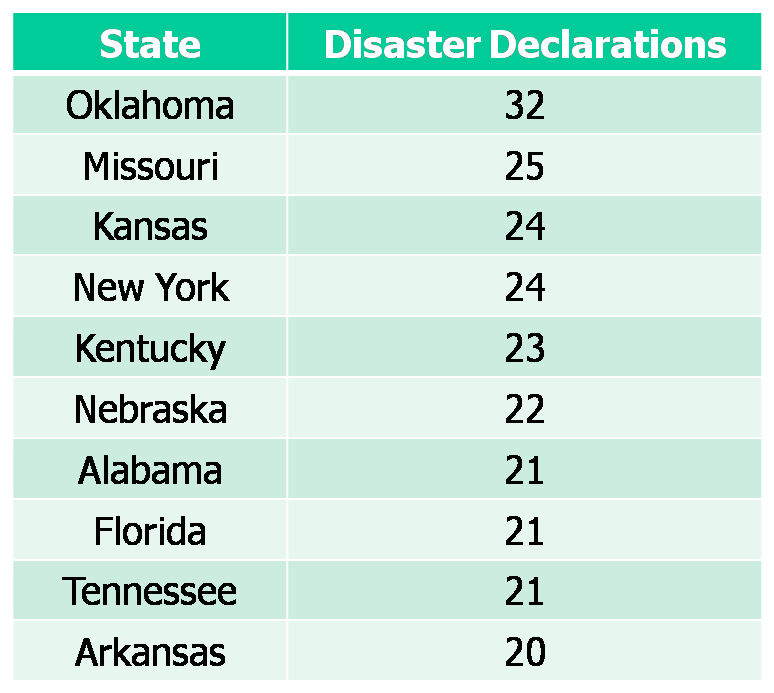
To start, let's remember that 2011 certainly didn't start our ride with extreme
weather. In fact, since the year 2000, Oklahoma has had more FEMA declared
disasters than any other state. And agricultural disasters aren't included in
these numbers, updated through August.
********
January: Actually a fairly boring month. The drought was just getting started
(October 2010). So a dry and cold January (33rd coolest and 6th driest since
1895)? Don't stop the presses. The average statewide precipitation was 0.24
inches. All heck started to break loose late on January 31, however.
********
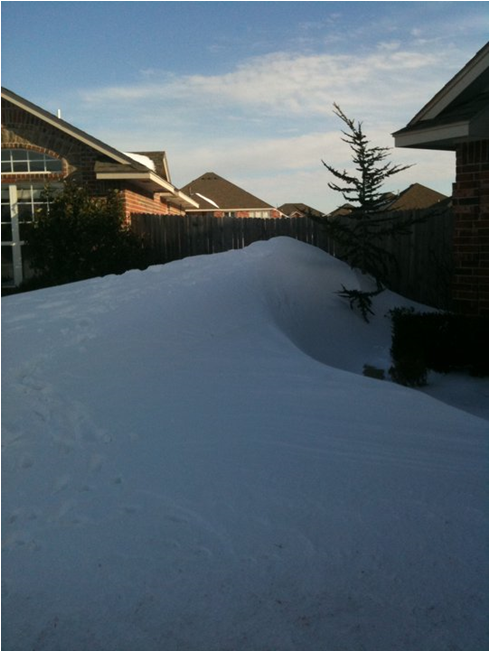
February: Two blizzards, record cold, record snow, heat ... February had it all
in one month. Up to 21 inches of snow fell in northeast Oklahoma and widespread
reports of 6-12 inches covered much of the state. Winds of up to 60 mph
contributed to massive drifts of over 5 feet (including this one outside my
house up against a 6-foot privacy fence).
A second snowstorm brought snow to southeastern Oklahoma with 4-5 inches on
the the fourth and fifth. A bit of a melt period until February 8-10. A new
all-time 24-hour record of 27 inches of snow fell in Spavinaw between February
8-9. That broke the previous record of 26 inches set in late March 2009 in
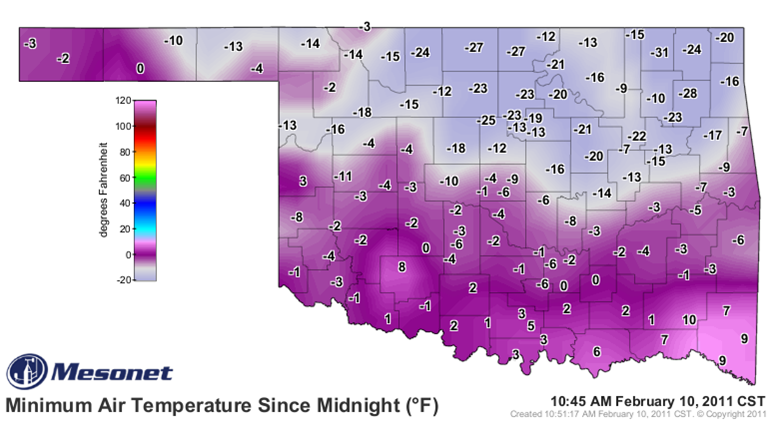
the northwest. To add insult to injury, high pressure settled over northeastern
Oklahoma and with a fresh snowpack, crystal clear skies and light winds, the
temperature plummeted to a never before seen low of -31 degrees at the Nowata
Mesonet site. Nowata was not alone in getting its timbers shivered, as
evidenced by the Mesonet low temperature map from that morning.
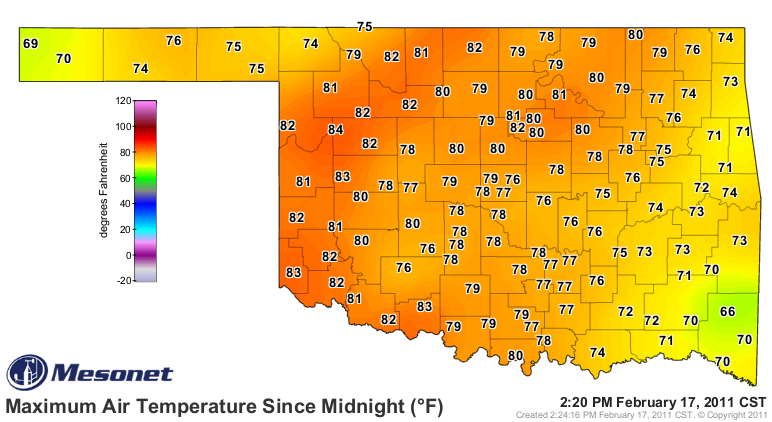
Then as proof that Mother Nature was just messing with us, she brought a swift
and steady warm up through the next seven days, culminating in a 110-degree
temperature swing at Nowata in a week's time.
Throughout all of this, the drought was still intensifying.
********
March: Dry, warm and dull. The month ended as the 31st warmest and 8th driest
since 1895. Drought continued to intensify.
********
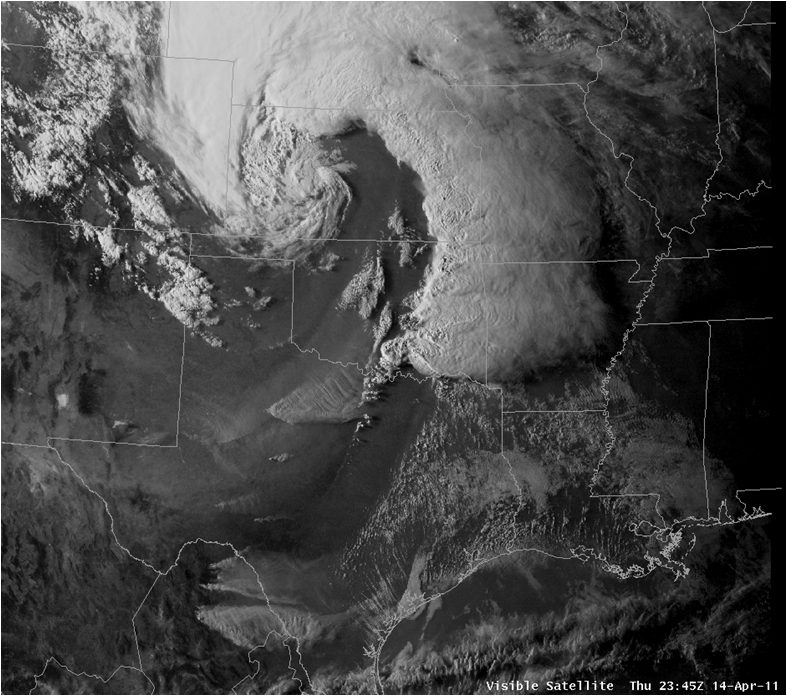
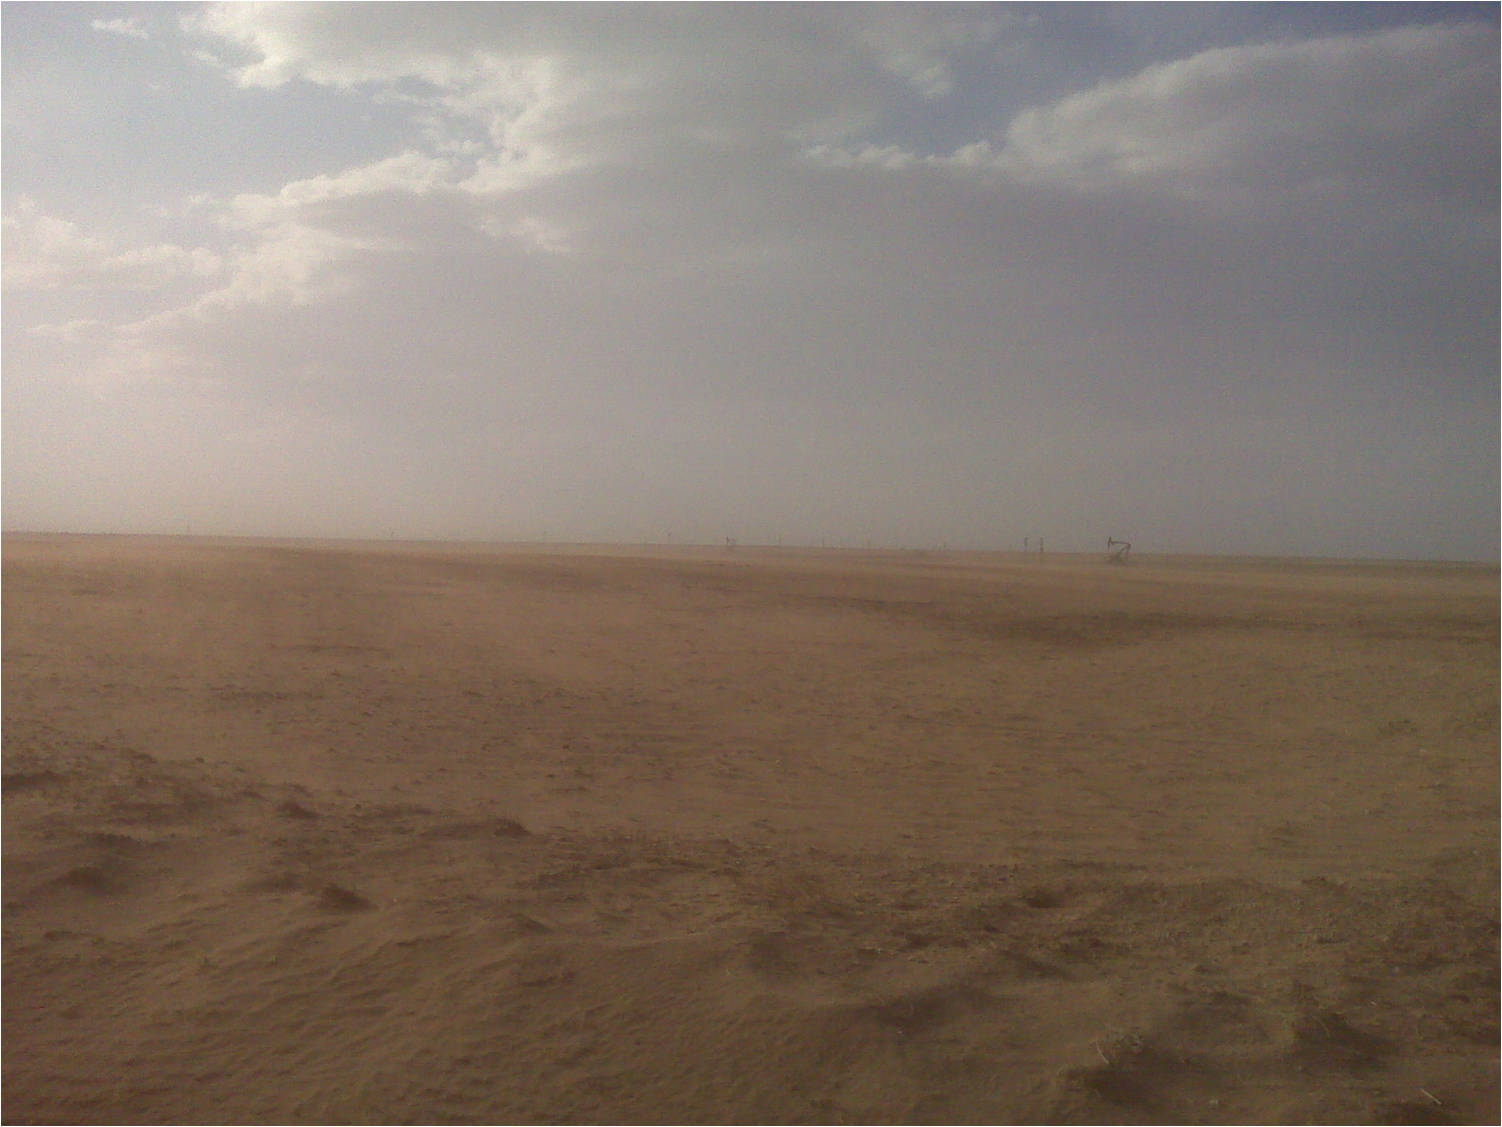
April: Mother Nature reasserted herself, lest we grow complacent, and provided
us with the most tornadoes (50) in April since accurate records began in 1950.
The previous record was 40 back in 1957. Proof that droughts of a feather flock
together, all of those 50 tornadoes struck east of I35 while the drought-ravaged
western half of Oklahoma was left eating dust (literally) on the backside of
the storm systems. Two people were killed by an EF3 tornado that struck the
the small town of Tushka in Atoka County.
Ponca City reported a 94 mph wind gust on the eighth to go along with more than
a half dozen instances of softball size hail during the month. There was plenty
of flooding with the heavy rains in the eastern half of the state.
Destruction of a significant portion of the state's wheat crop was well underway
at this time as the drought continued to intensify (even as drought was ending
in eastern Oklahoma).
********
May: Tornadoes, including an EF5 killer, ravaged the state during May. And yes,
the drought continued to intensify. The 46 twisters during May killed 11,
including nine by the EF5 that traveled from near Hinton to Guthrie on May 24.
Along the way, that monster gave a glancing blow to the Oklahoma Mesonet site
at El Reno. The El Reno Mesonet site recorded a maximum wind gust of 151 mph,
setting the record for strongest surface wind ever measured (non-radar) in
Oklahoma.
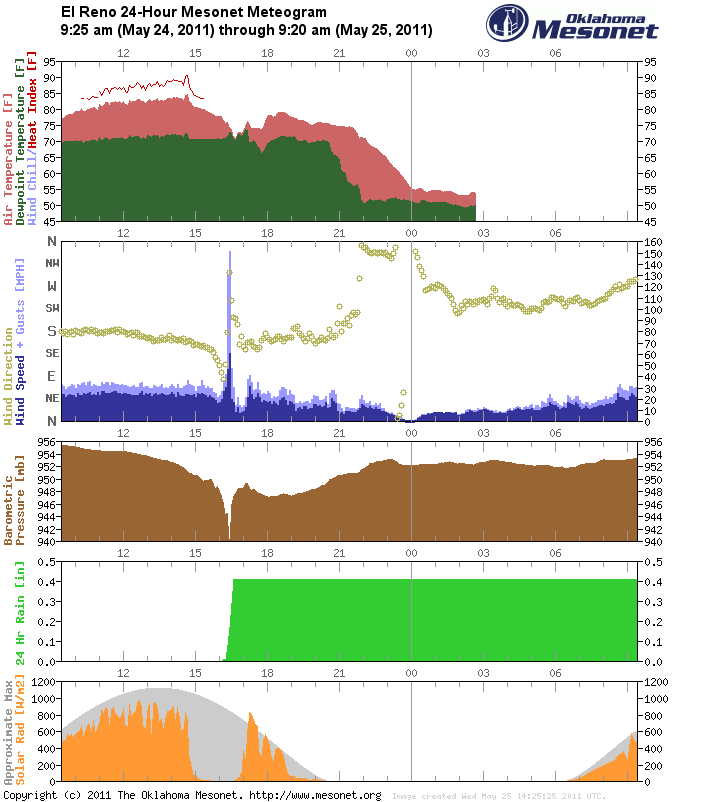
The tornado turned an active oil rig next to I-40 into a mangled mass of metal.
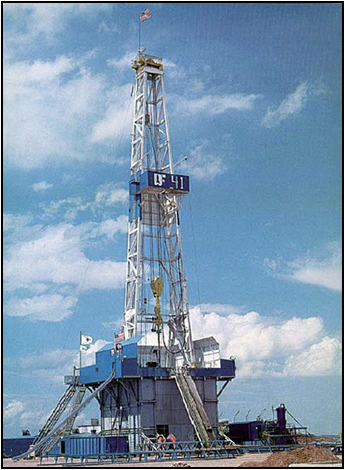
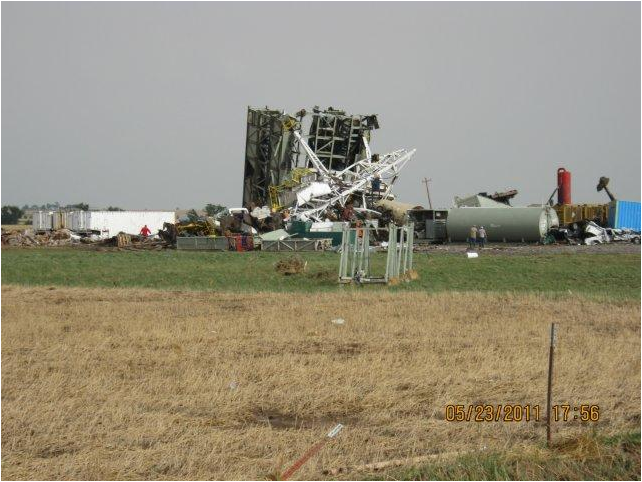
Two EF3s, two EF4s and the EF5 all struck on May 24th.
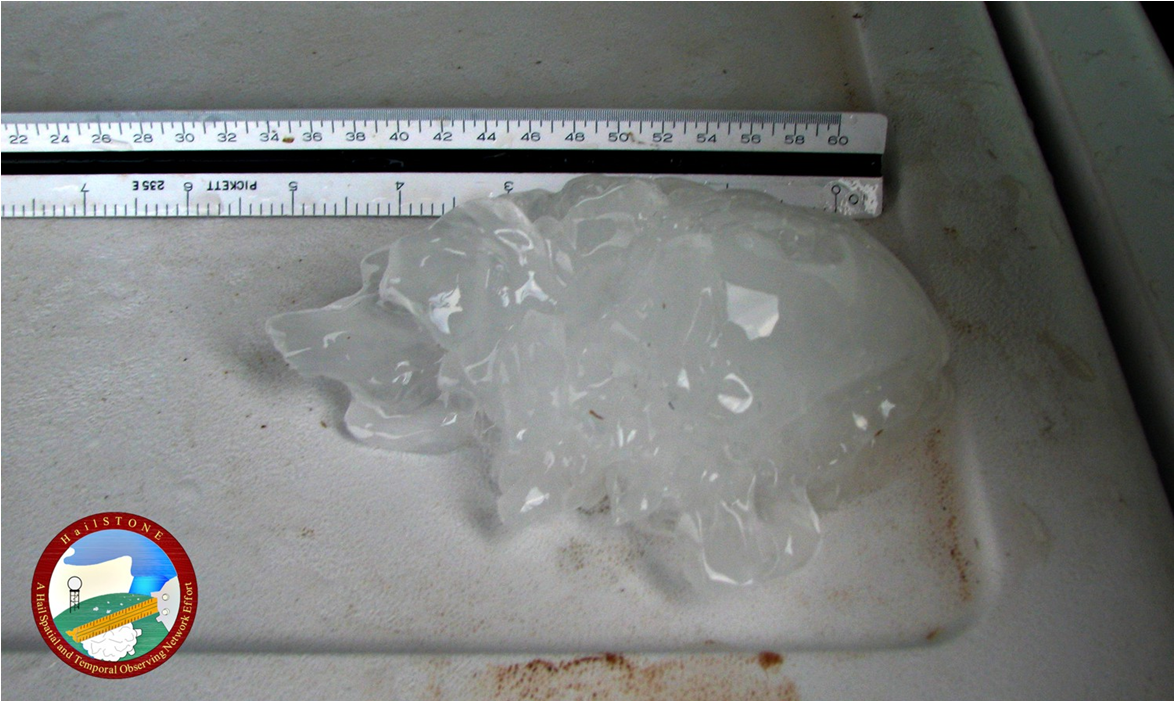
The day before, a supercell near Gotebo dropped a 6-inch diameter hailstone,
which set a new record in that particular category for the state.
And the drought raged on in the west but was largely gone in the east. Not for
long, however.
********
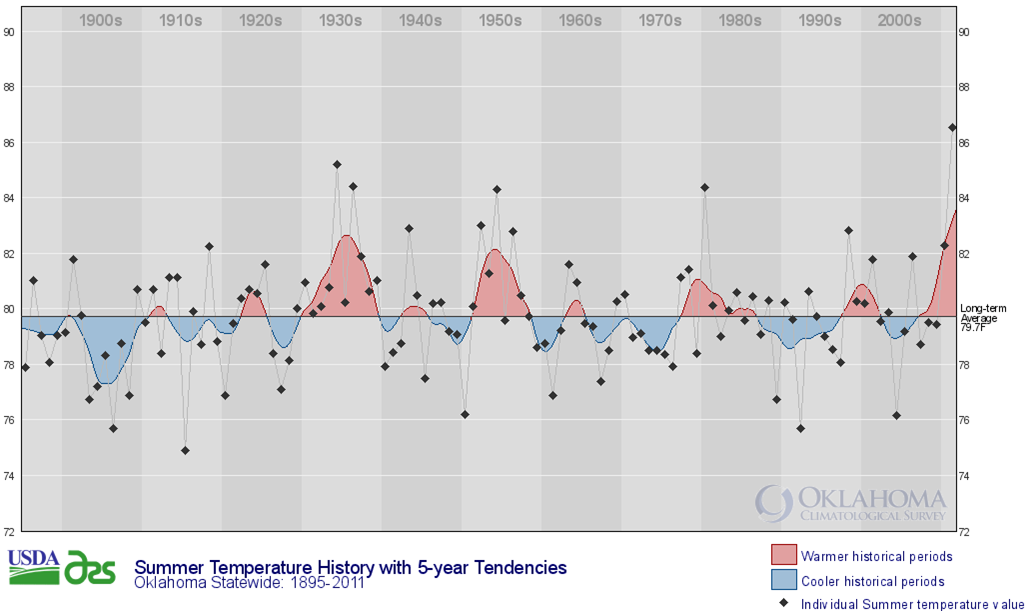
June, July and August: The summer from hell. Simply put, the hottest summer for
any state since records began in 1895 with a statewide average of 86.8
degrees. Now not only did Oklahoma beat its own record for the previous hottest
summer of 85.2 degrees from 1934, it destroyed it by 1.6 degrees. In fact,
Oklahoma now owns five of the 10 (11 with a tie) hottest summers across the
U.S. since records in 1895.
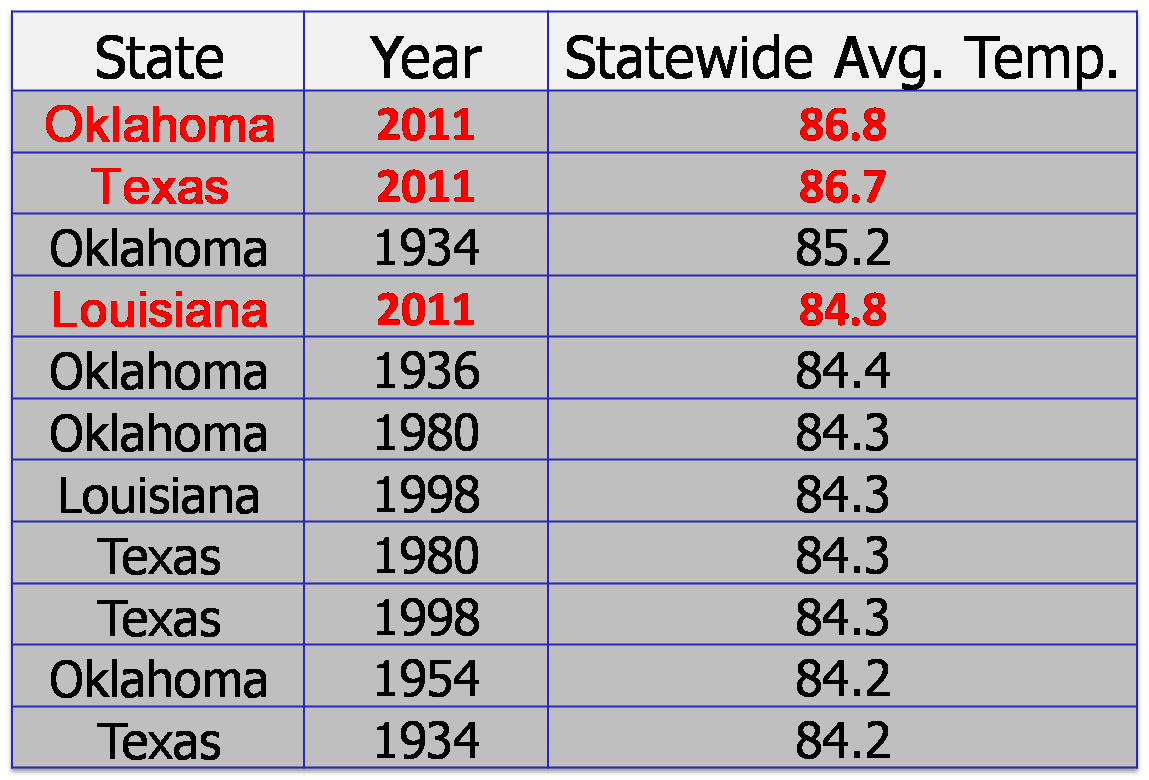
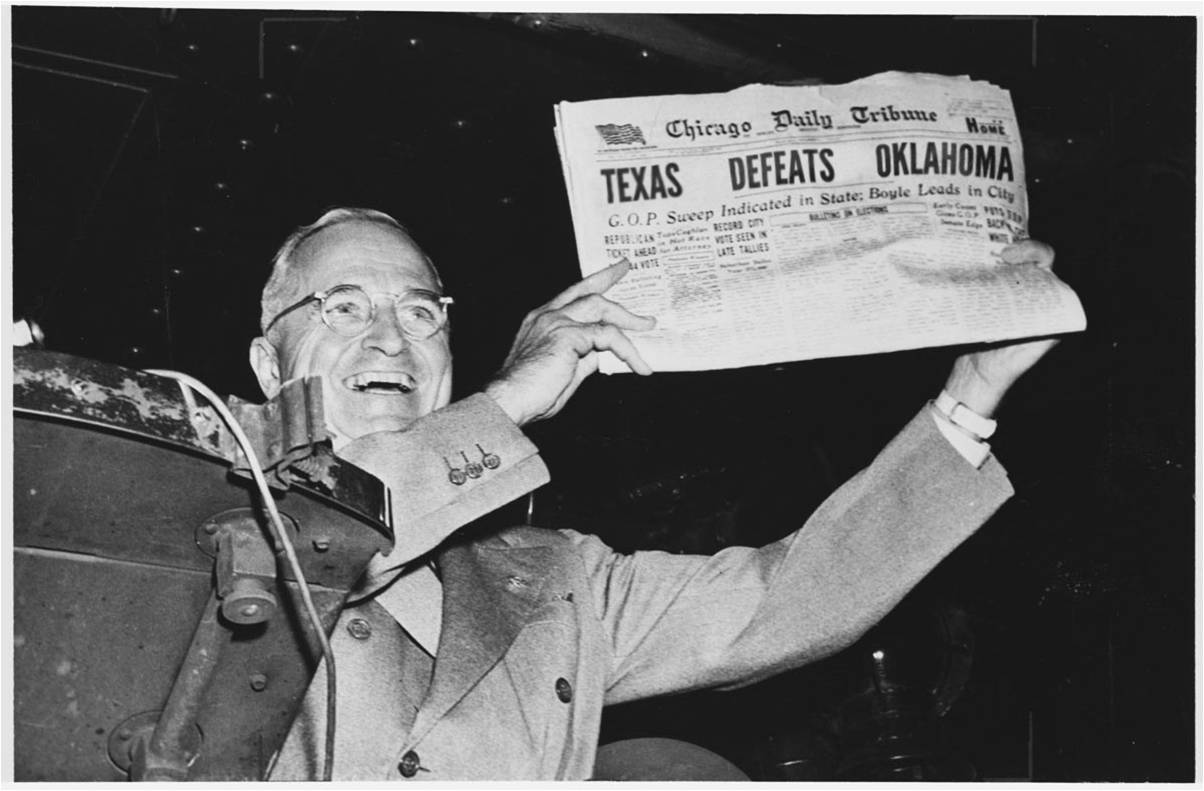
Previous reports had Texas on top of the summer heap, but data tends to trickle
slowly into the National Climatic Data Center. Now that the true champ has been
crowned, even folks from Missouri are commiserating.
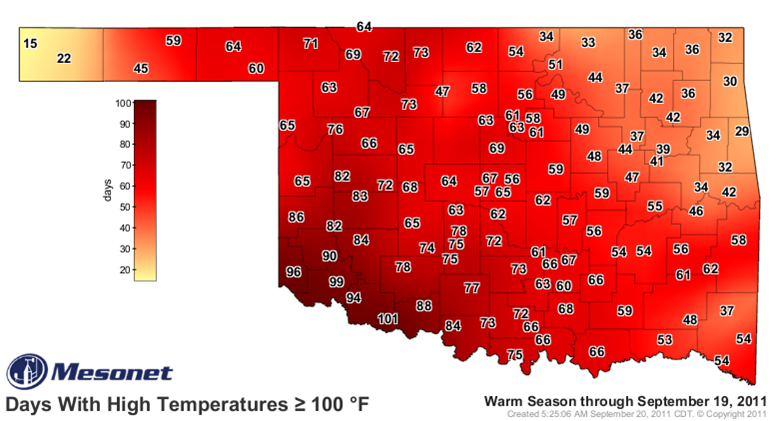
Why stop there? Why not break the record for most 100 degree days in state
history? Okay, will do. The previous record for most days at or above 100
degrees for a single location in the state was 86, set at Hollis back in 1956.
How about 87 days? How about 90 days? How about 100 days? Nah, let's go ahead
and take it a notch above and go for 101 days at Grandfield, as shown by the
following Mesonet map. And the record was not shattered by Grandfield alone.
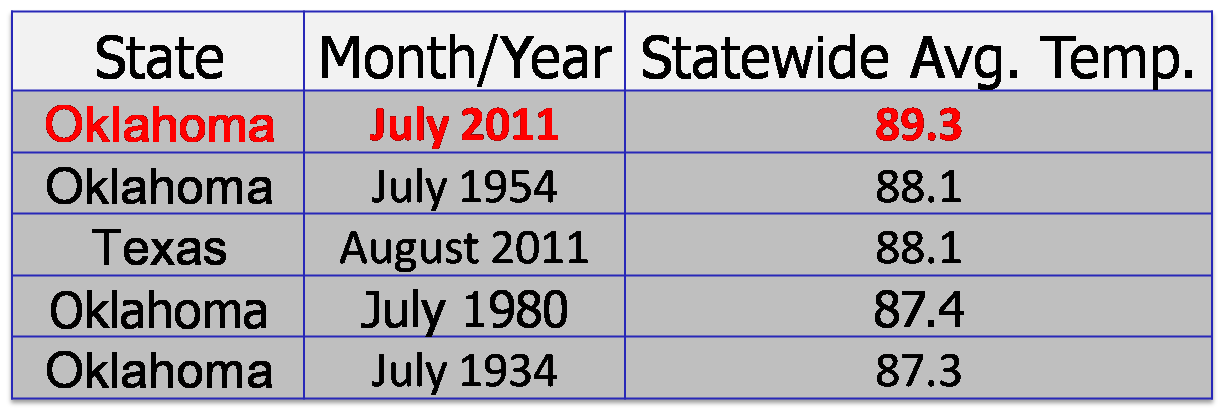
Let's not forget July. July's statewide average temperature for Oklahoma was
89.3 degrees. The previous hottest July in state history was 88.1 degrees back
in 1954. The previous hottest MONTH in state history was 88.1 degrees back
in 1954. The previous hottest month in ANY state back to 1895 was 88.1 degrees.
I'm almost out of words to capitalize. Yes, Oklahoma's July was the hottest
month of any month for any state back to 1895, beating out over 67,000 other
months for the top prize.
********
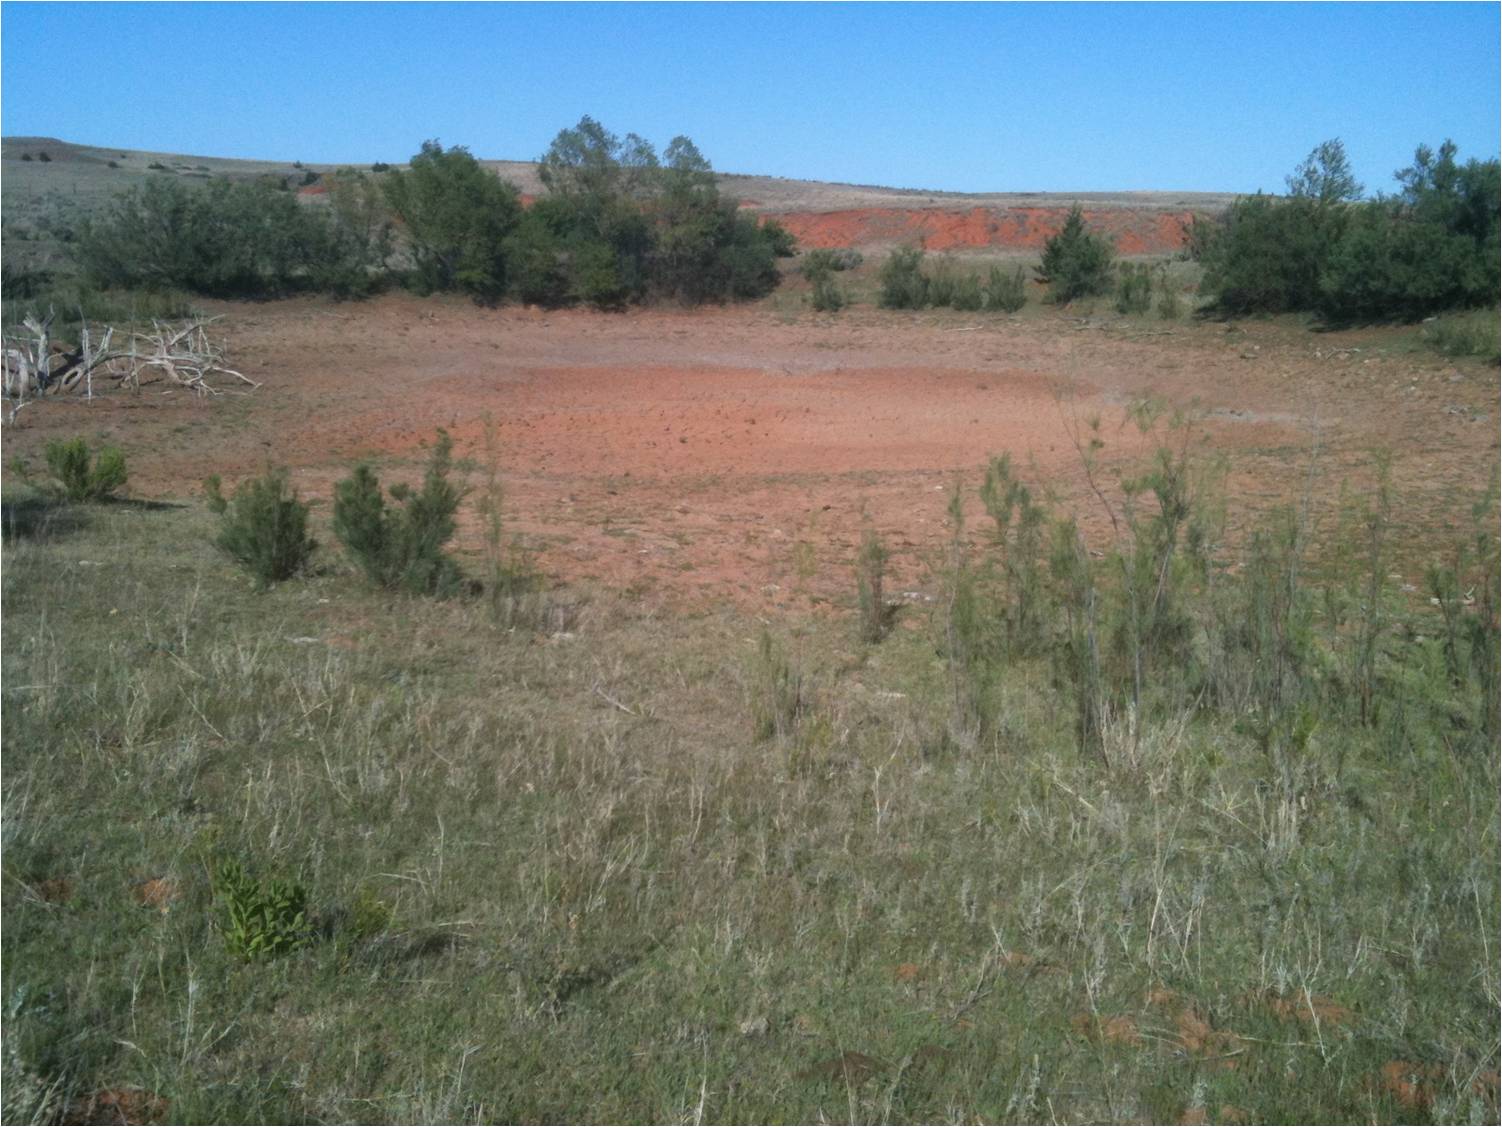
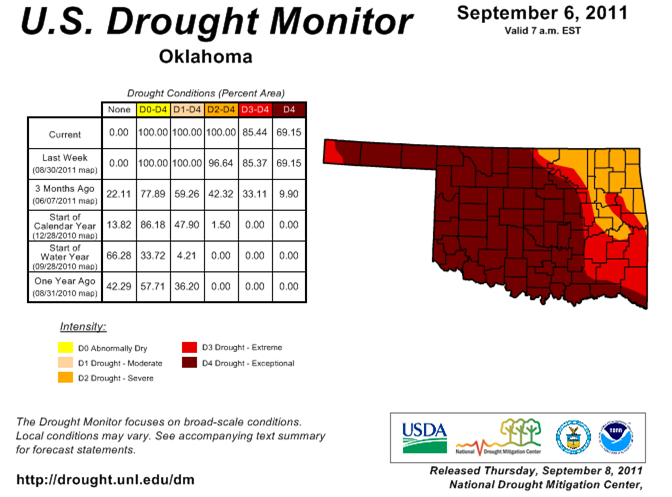
September: This month brought us two things ... the drought at its zenith and
nearly instantaneous relief from the summer heat. Nearly 70 percent of the state
was covered by the exceptional drought category by early September, and 85
percent was extreme/exceptional. The sun, heat and lack of precipitation had
taken its toll for three very long months.
The statewide average temperature for September was 1.4 degrees below normal and
the 32nd coolest since 1895. The relief started on September 4 with an unusually
strong cold front and it was clear sailing from there for the most part. Ft.
Supply reached a low of 37 degrees on the sixth, just days after triple digit
temperatures peppered the state. The month was also the 20th driest on record
at 2.15 inches below normal.
********
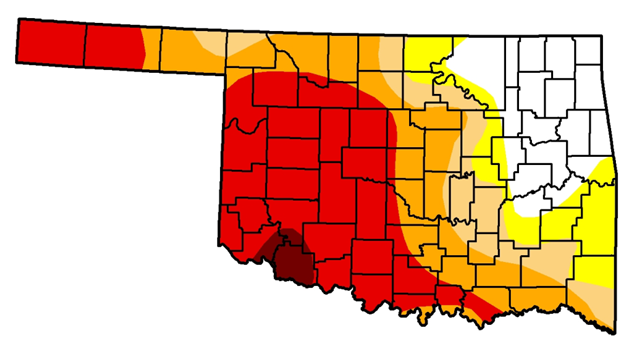
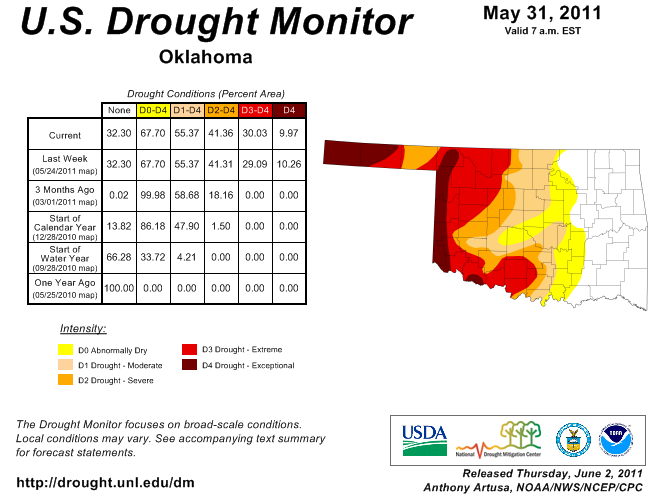
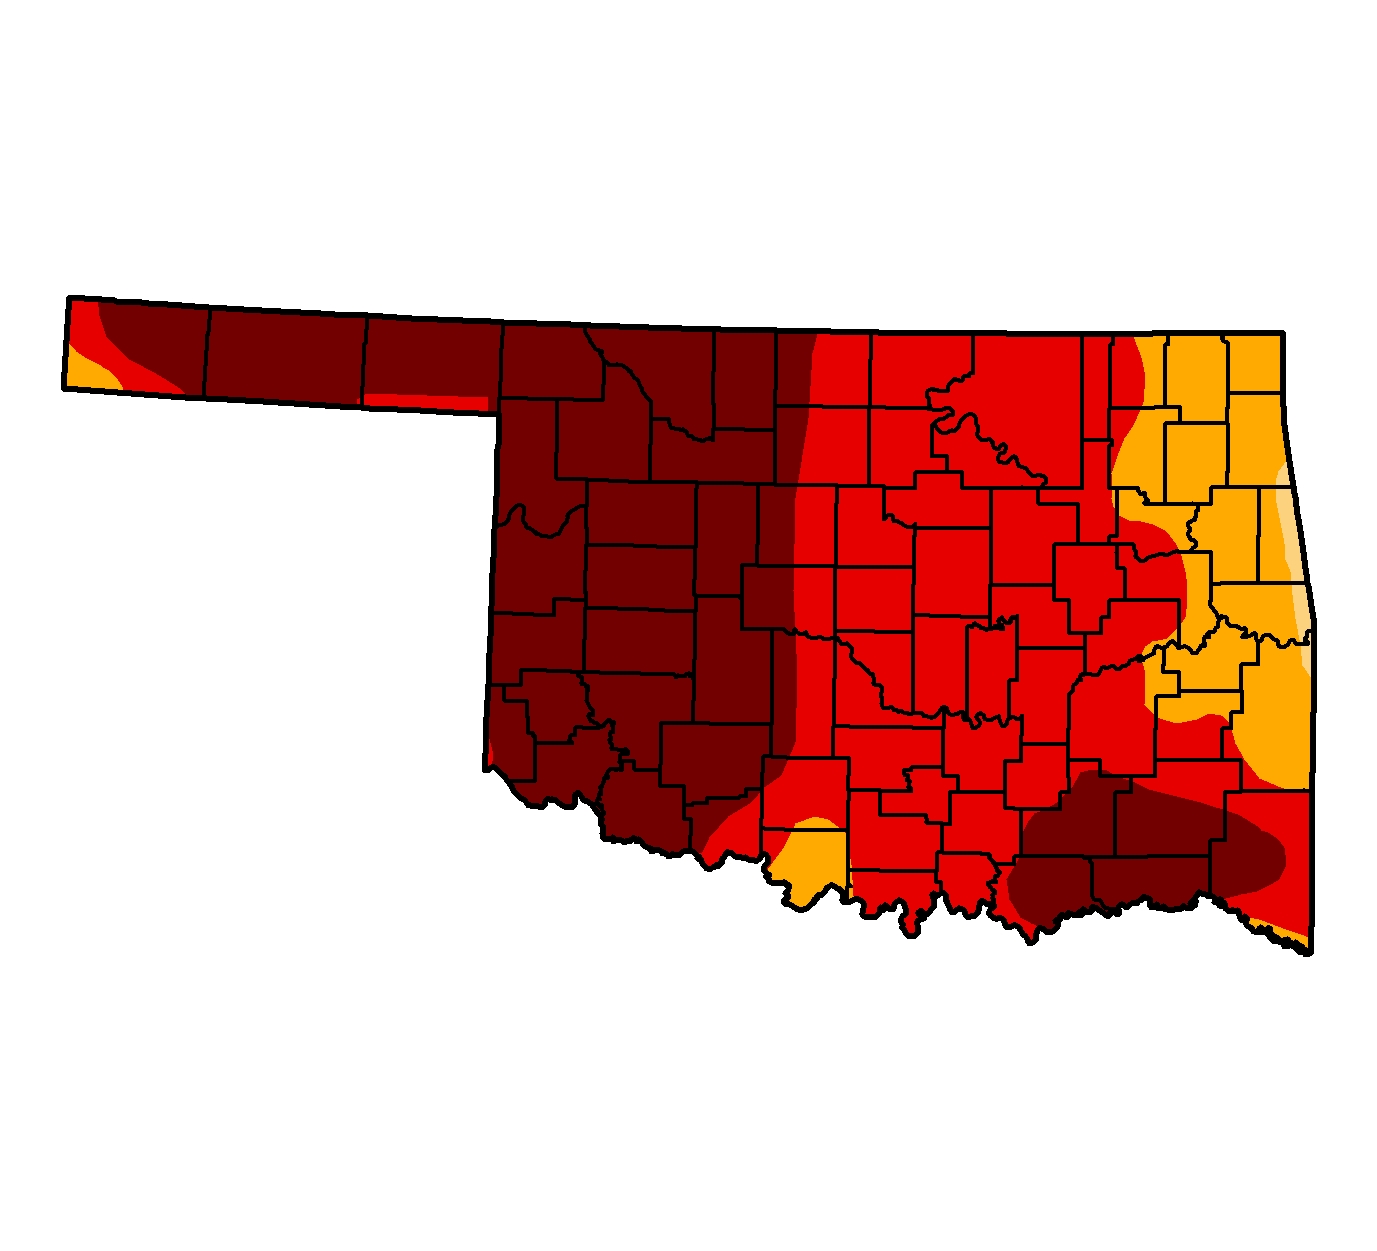
October: Drought relief came for central and northeastern Oklahoma. The Panhandle
even saw a bit of snow late in the month. October was a lot like how a want
my pizza ... a bit warm, moist in the middle and crispy on the edges.
This Drought Monitor image shows the relief was underway at month's end. Still
a lot of red, but the rains of October set up more relief during November's
first week.
********
November: Welcome to November 2011, the May of Autumn. A large storm system
brought flooding rainfall, a slew of tornadoes and two destroyed Oklahoma
Mesonet sites. The tally of tornadoes is at least a half-dozen, including an
EF2 grinder that tore through our Tipton Mesonet site.
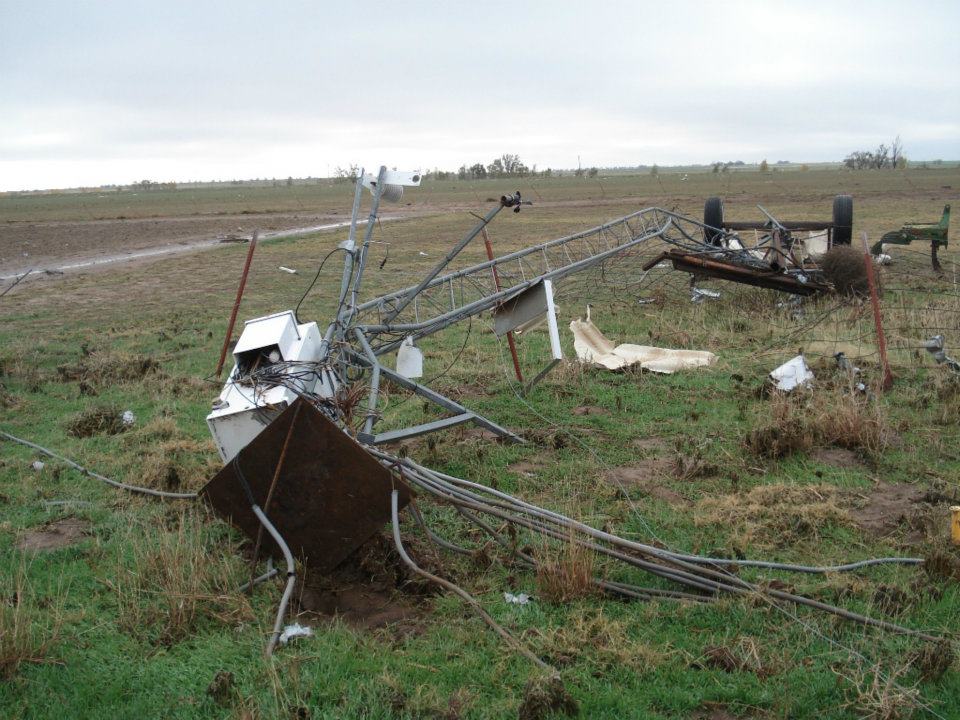
Fort Cobb was the other site to get blasted, although this one possibly took a
direct hit by debris (a center pivot irrigation system) instead of by the
tornado itself.
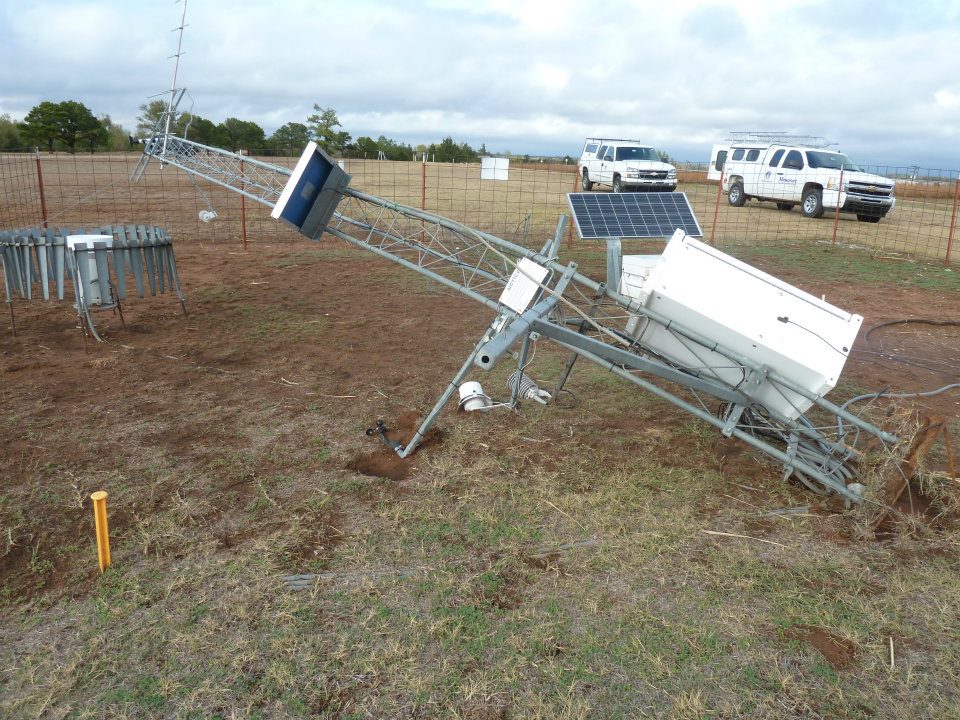
Unlike the May 24th El Reno EF5 encounter, these two sites were damaged by
debris before they could get to the really juicy wind measurements. They did
capture the pressure drop associated with a tornado quite well.
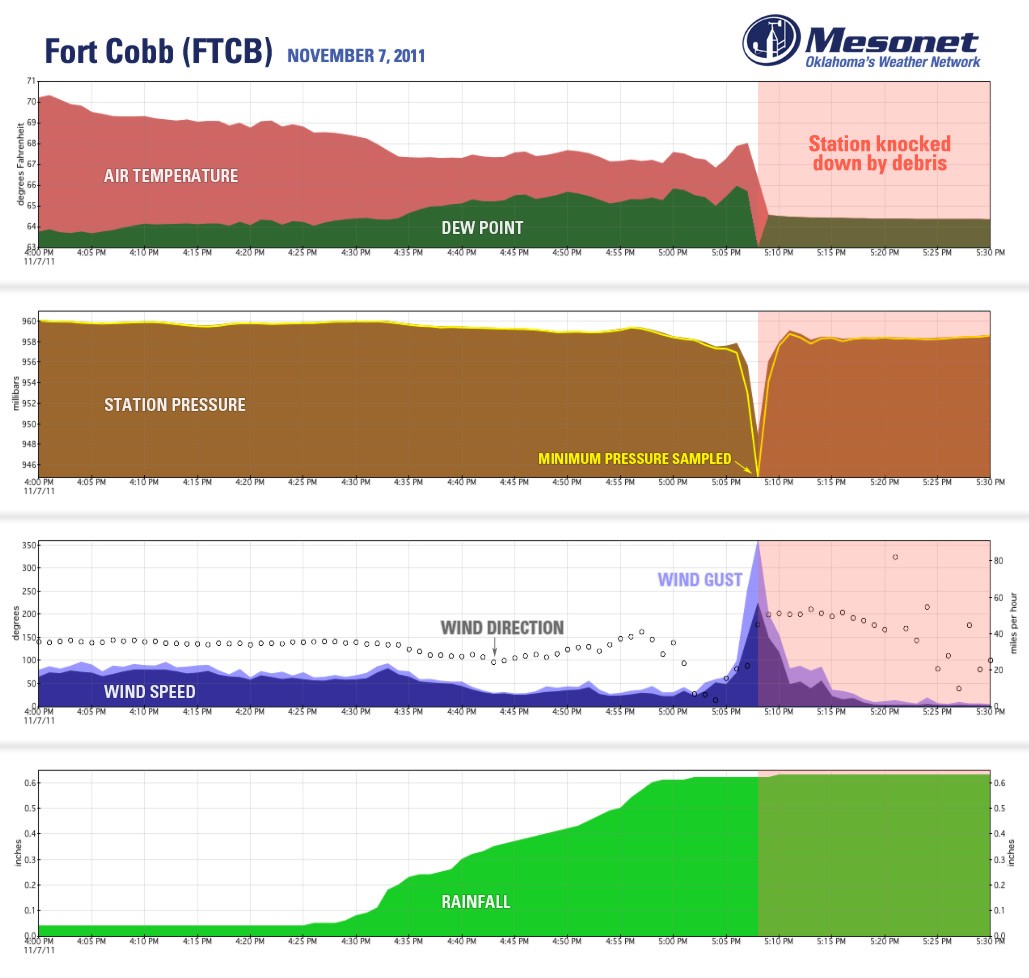
Here's a plot of the 1-minute data we recovered from Fort Cobb. Wind gusts went
from 25 mph at 5:06 PM to 64 mph at 5:07 PM to 91 mph at 5:08 PM. A large
irrigation pivot from a nearby field knocked the tower down before we were able
to capture the next observation of wind data.
We're also plotting the minimum pressure sample we observed (yellow line). The
barometer is sampled every 12 seconds to create our one-minute average data
(shaded brown area). One of those samples dropped all the way to 944.81 mb
(station pressure).
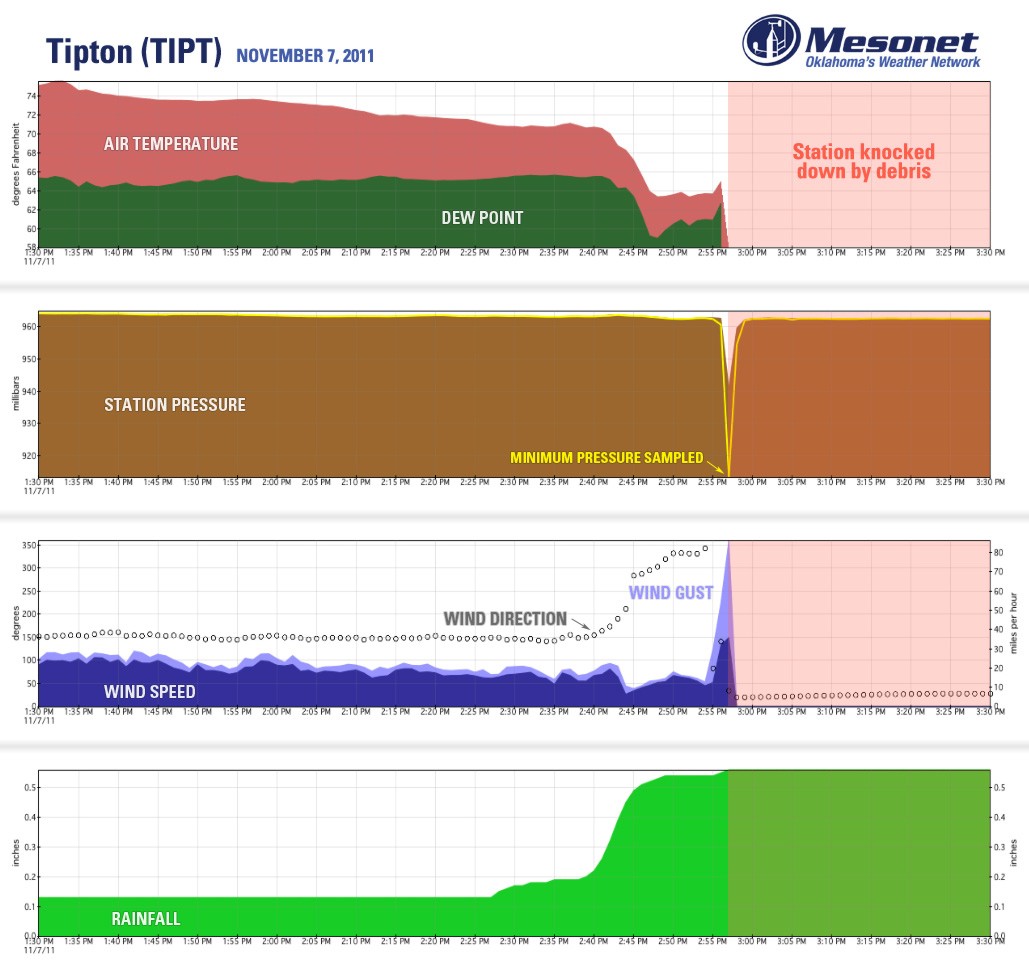
Same type of plot from Tipton. As you can see, the tornado hit fast and
furious. Wind gusts went from 30 mph at 2:55 PM to 54 mph at 2:56 PM to 86 mph
at 2:57 PM. Large debris took the tower down before we were able to capture the
next observation of wind data. One of the pressure samples dropped all the way
to 913.47 mb (station pressure).
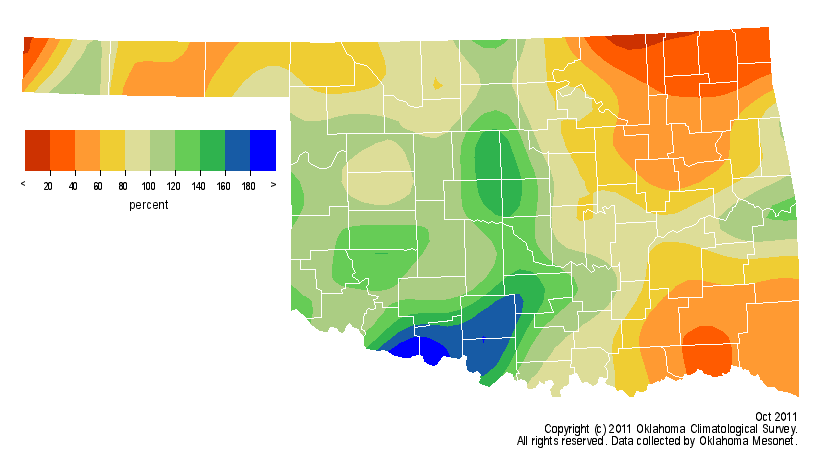
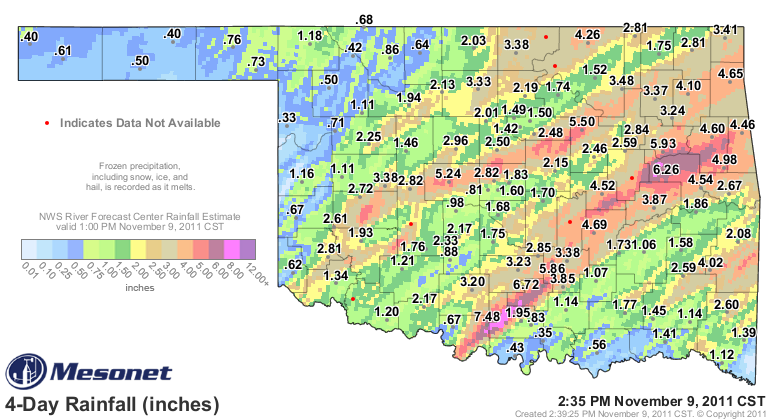
The flooding rains were the other big story during this event. This plot from
the Oklahoma Mesonet shows where drought is on the run in the state.
********
Did I just write all of that? That's okay, the entire Ticker staff is now
patiently awaiting our next disaster. We've about covered them all this year.
The only thing left?
Watch out Prague.
Gary McManus
Associate State Climatologist
Oklahoma Climatological Survey
(405) 325-2253
gmcmanus@mesonet.org
November 9 in Mesonet History
| Record | Value | Station | Year |
|---|---|---|---|
| Maximum Temperature | 88°F | HOLL | 2012 |
| Minimum Temperature | 16°F | EVAX | 2018 |
| Maximum Rainfall | 2.04″ | TALI | 2023 |
Mesonet records begin in 1994.
Search by Date
If you're a bit off, don't worry, because just like horseshoes, “almost” counts on the Ticker website!