Ticker for July 26, 2012
MESONET TICKER ... MESONET TICKER ... MESONET TICKER ... MESONET TICKER ...
July 26, 2012 July 26, 2012 July 26, 2012 July 26, 2012
*NOTE* OCS solicited drought conditions and impacts from the state's county
FSA and NRCS offices to provide as expert input for this week's U.S. Drought
Monitor effort. It is through the hard work of those local and state
agents that this more-complete drought picture was provided. Nearly every
county chimed in. The news was not pretty, to say the least, but we hope this
week's Drought Monitor map more accurately reflects the conditions being faced
across the state out in the field. You will find a few pictures of drought
damage at the bottom of the Ticker.
-------------------------------------------------------------------------------
Driven by intense heat, wind and one of the driest May-July periods on record,
the flash drought and its impacts continued to accelerate in Oklahoma. The U.S.
Drought Monitor map released this morning now portrays 91% of the state in at
least severe drought (D2-D4), the most since Nov. 8, 2011. Exceptional (D4)
drought also makes an unwelcome return to Oklahoma in Ellis and Roger Mills
counties, its most significant presence since early March 2012 when drought was
seemingly on the way towards extinction. A scant three months ago, only 15% of
the state was even considered in any type of drought, at least according to the
Drought Monitor.
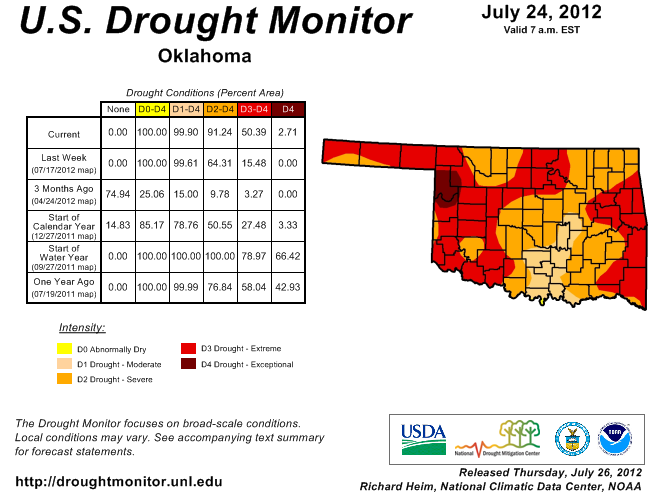
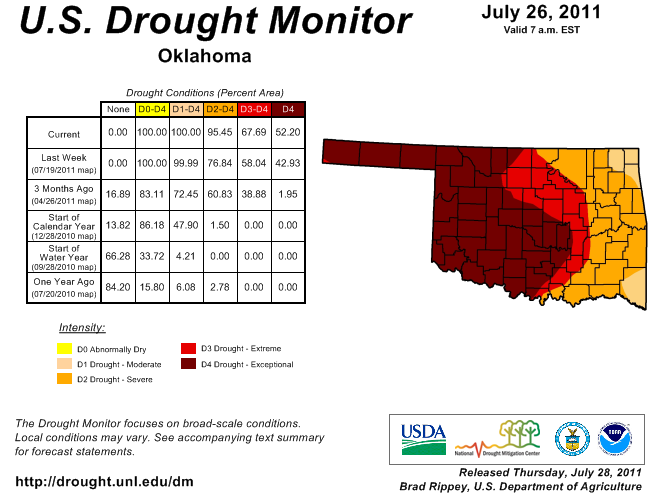
More than 50% of the state is now portrayed in extreme-exceptional drought, the
most since Nov. 15, 2011. At this time last year, more than 50% of the state
was covered in exceptional drought, with 70% in the extreme-exceptional
categories.
The severity of the drought on a national scale also increased accordingly.
More than 38% of the country is now considered to be in severe-exceptional
drought, the most since the Drought Monitor effort began in 2000 (last week's
extent and also the Sept. 10, 2002, amounts rank #2 and #3).
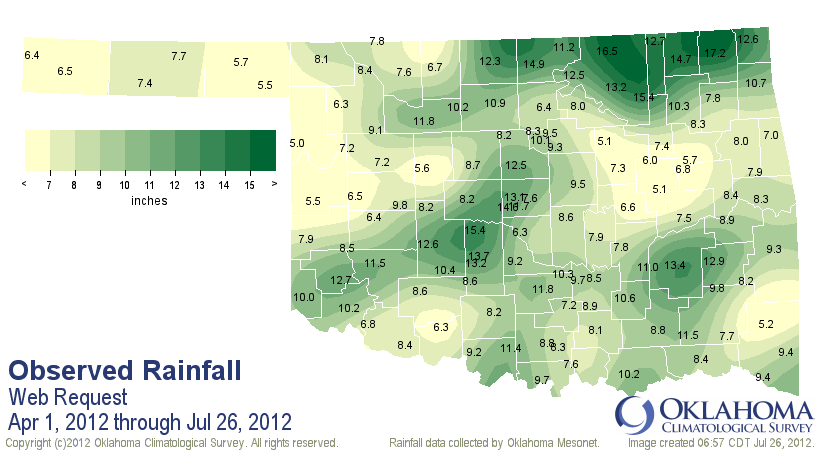
The recipe for this accelerating flash drought remains simple: too much heat
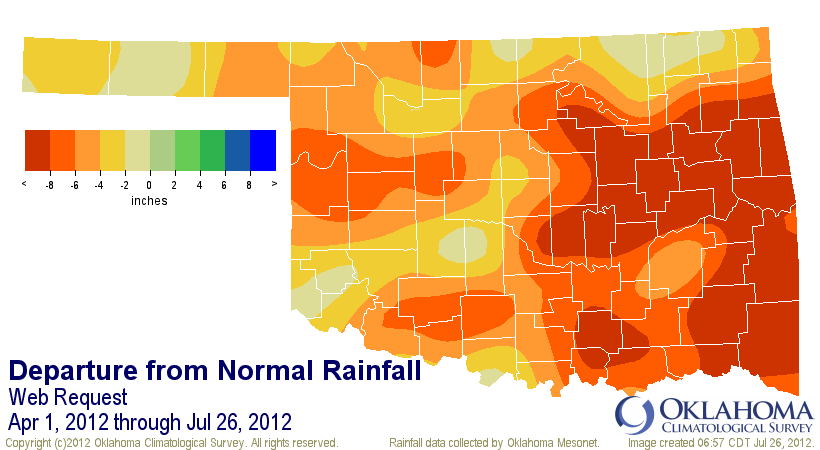
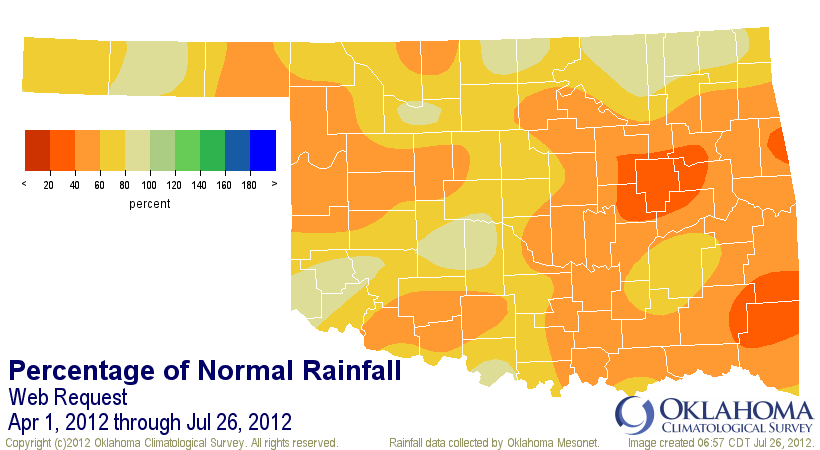
and too little rain. Here's a rundown of our rainfall statistics from April
through today via the beginning of each month.
April 1-July 26 rainfall
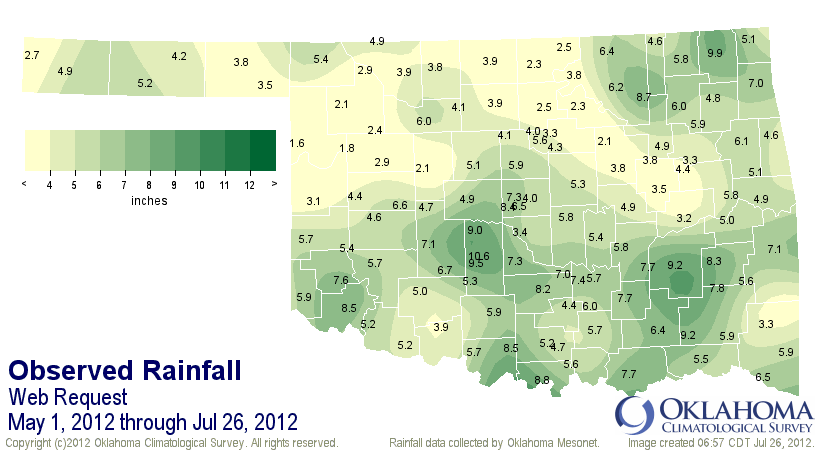
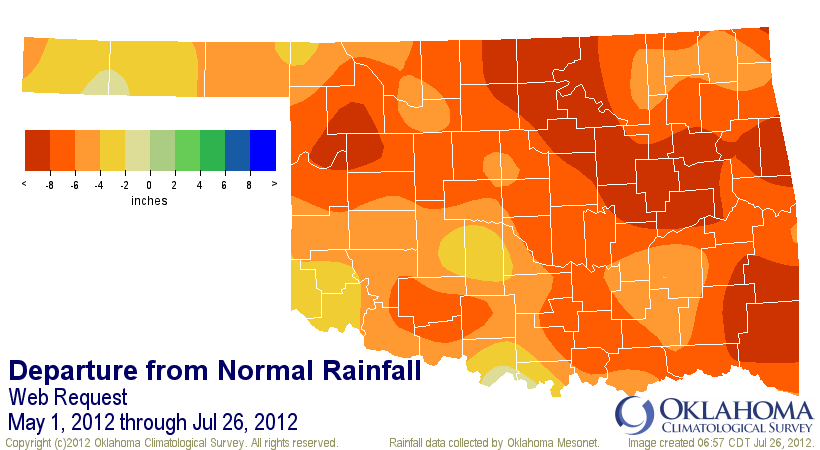
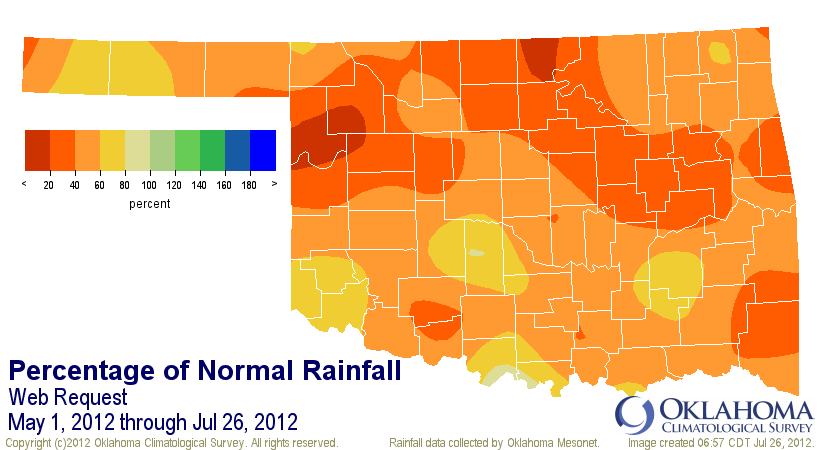
May 1-July 26 rainfall
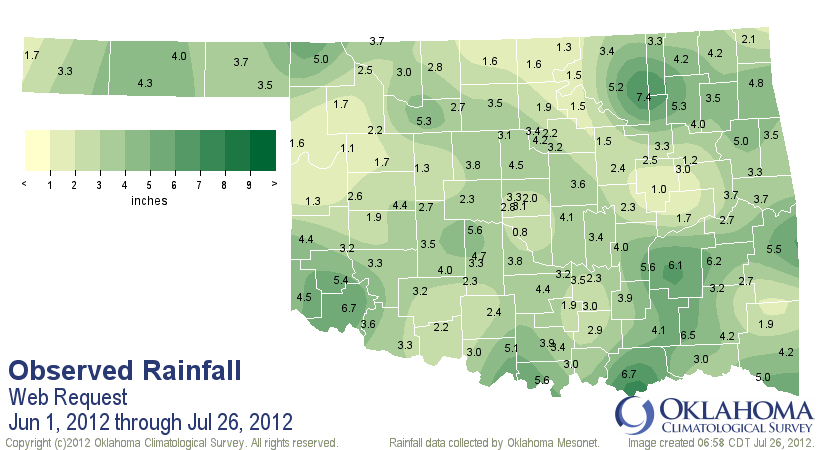
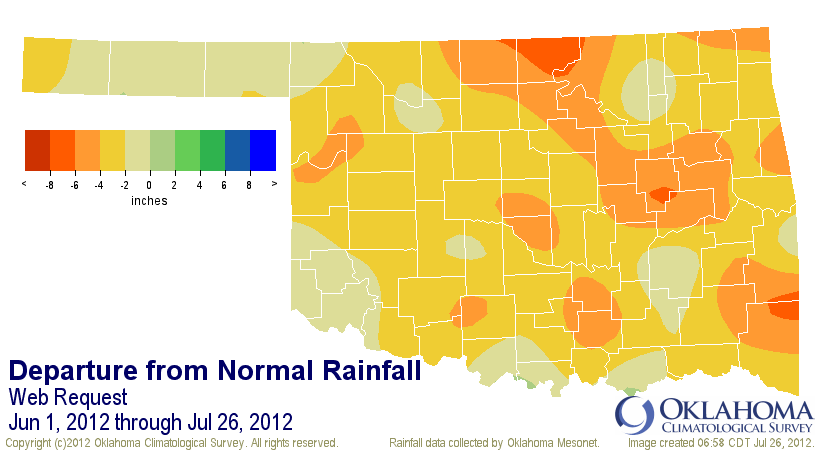
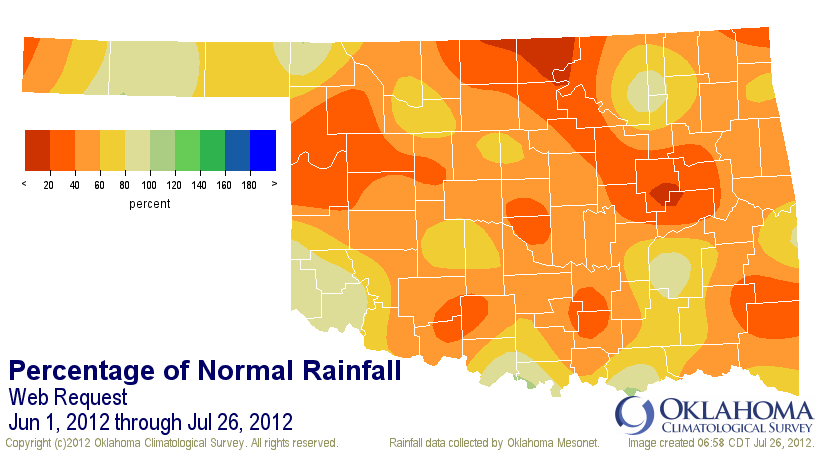
June 1-July 26 rainfall
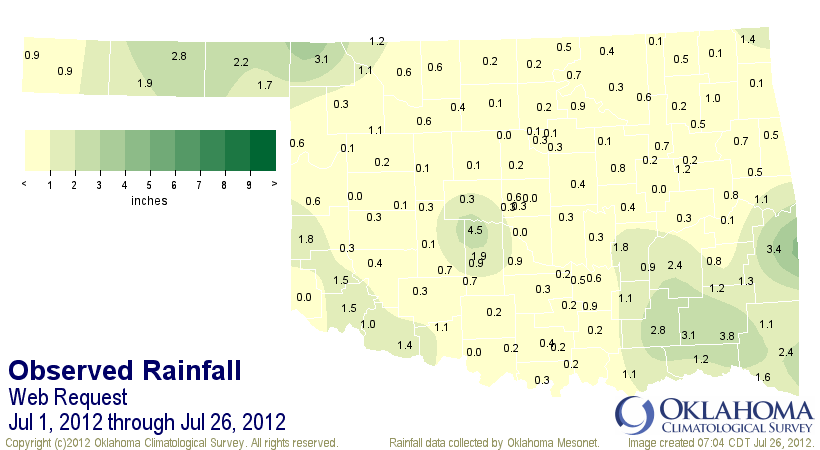
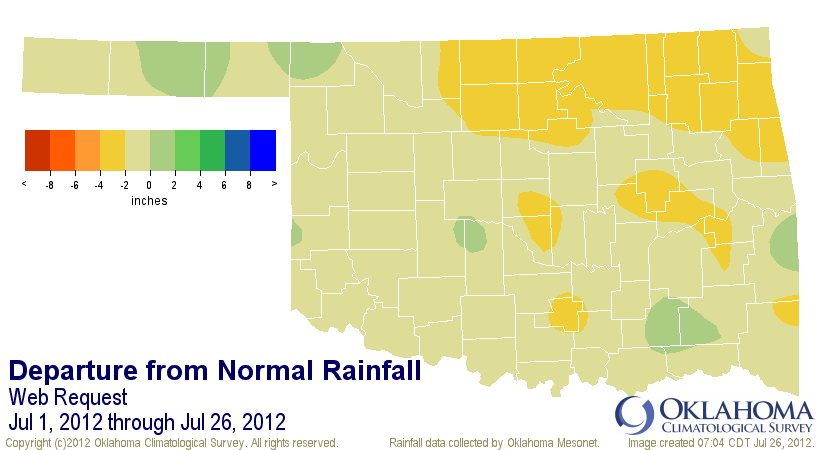
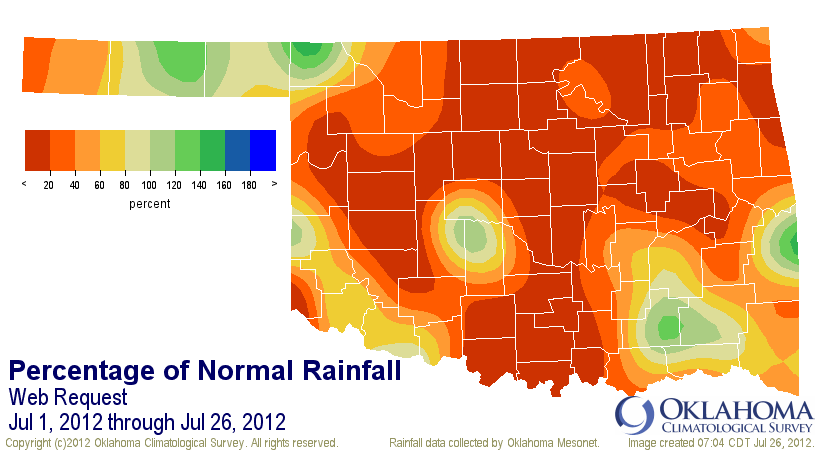
July 1-July 26 rainfall
-****-
April-July average statewide rainfall statistics
Period Avg. Tot. Dep. Pct. Norm. Rank since 1921
Apr 1-Jul 26 9.05" -5.93" 60% 3rd driest
May 1-Jul 26 5.24" -6.42" 45% 1st driest
Jun 1-Jul 26 3.39" -3.14" 52% 7th driest
Jul 1-Jul 26 0.85" -1.44" 37% 11th driest
-***-
As you can see, it's that deficit from April and May through today that is most
significant, since those losses encompass the bulk of our spring rainy season.
It's supposed to be dry from mid-June through July (and through August as well),
so it takes significant dryness to rank in the top-5 for those periods. Given
that the June-July period will probably finish top-10 or top-15, depending on
what happens with this current rain, that's still an unfortunate ranking. Even
a top-15 ranking during those months ends up meaning REALLY dry. However, the
seeds of this disaster were obviously planted back in April and May. June and
July were the fertilizer.
We can't ignore the significant damage done by last year's drought that left
a significant portion of the state suffering from extreme-exceptional drought
for more than six months. That no doubt the ecosystem was weakened and left more
vulnerable to the current flash drought. That was confirmed by many of the
county agents we solicited input from. Take a look at the rainfall maps from
Oct. 1, 2010 (generally thought to be the beginning of the drought, although
its roots can probably be traced back to that summer) through today. These maps
reflect the long-term nature of the drought, even thought it is understood that
the drought's intensity has ebbed and waned throughout the period.
Oct. 1, 2010-Jul 25, 2012 Mesonet rainfall maps
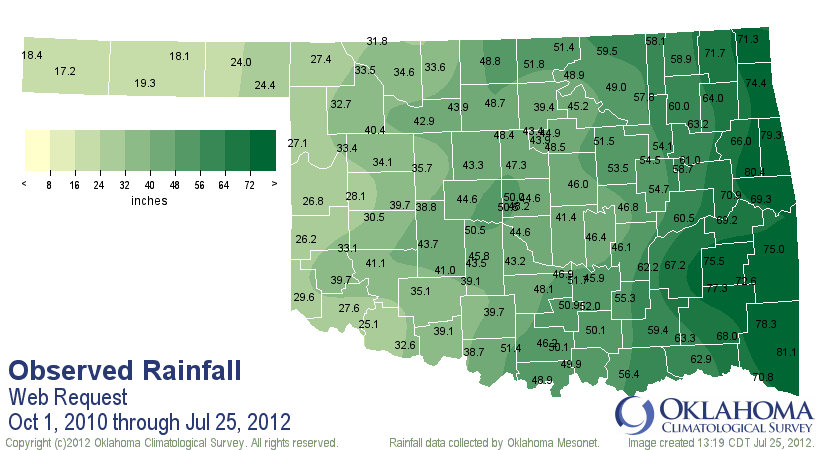
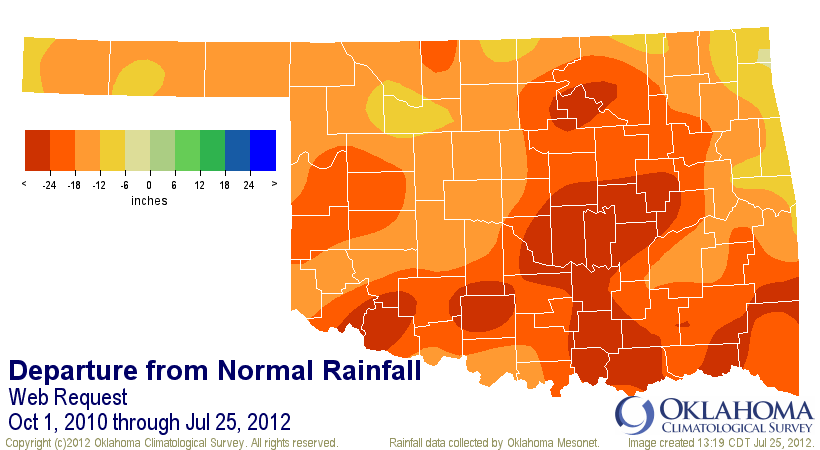
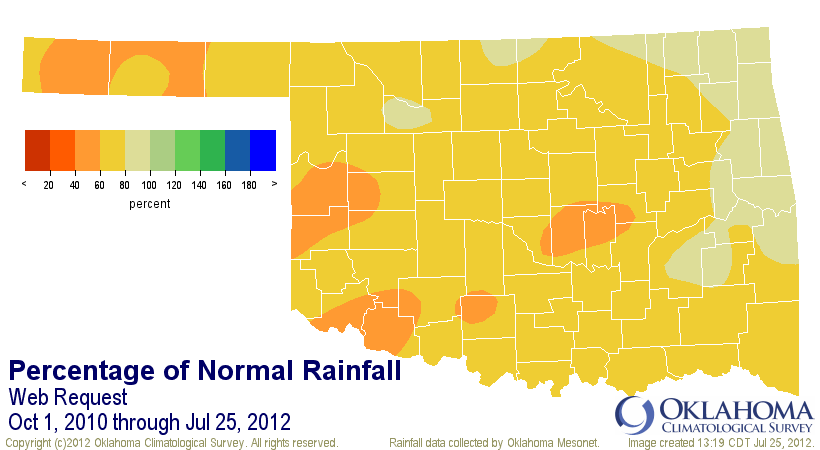
The statewide average through that period is 46.91", which sounds pretty good,
but that is actually 19.11" below normal.
I wish there was better news on the horizon, but as we've said before, summer
is not an ideal time to look for drought relief, especially with August staring
us in the face. The chance for rain over the next couple of days still exists,
although it is not going to be a drought-buster. The rains last night were once
again too localized to benefit a large area. But here are the forecast rainfall
amounts for the next five days.
The medium-term outlooks from the Climate Prediction Center continue to show
increased odds of above normal temperatures and below normal precipitation for
the first 10 days of August or so as the upper ridge of high pressure plants
itself over the state once again. These things can change rather suddenly,
and more chances for rain may arise. The chances for relief *SHOULD* increase
as we approach fall. Farther our, a developing El Nino is almost certain to
mature as we get into the cool season, which *CAN* give the southern tier of
the U.S. increased odds of a cooler/wetter period. Doesn't always happen, but
it's at least a change from the last two years of La Nina and it's dry/warm
signal.
REMEMBER(!!!), for some folks, this drought has been in place since that
October 2010 period, especially in western Oklahoma. For them, there has been
less waning, more ebbing.
-------------------------------------------------------------------------------
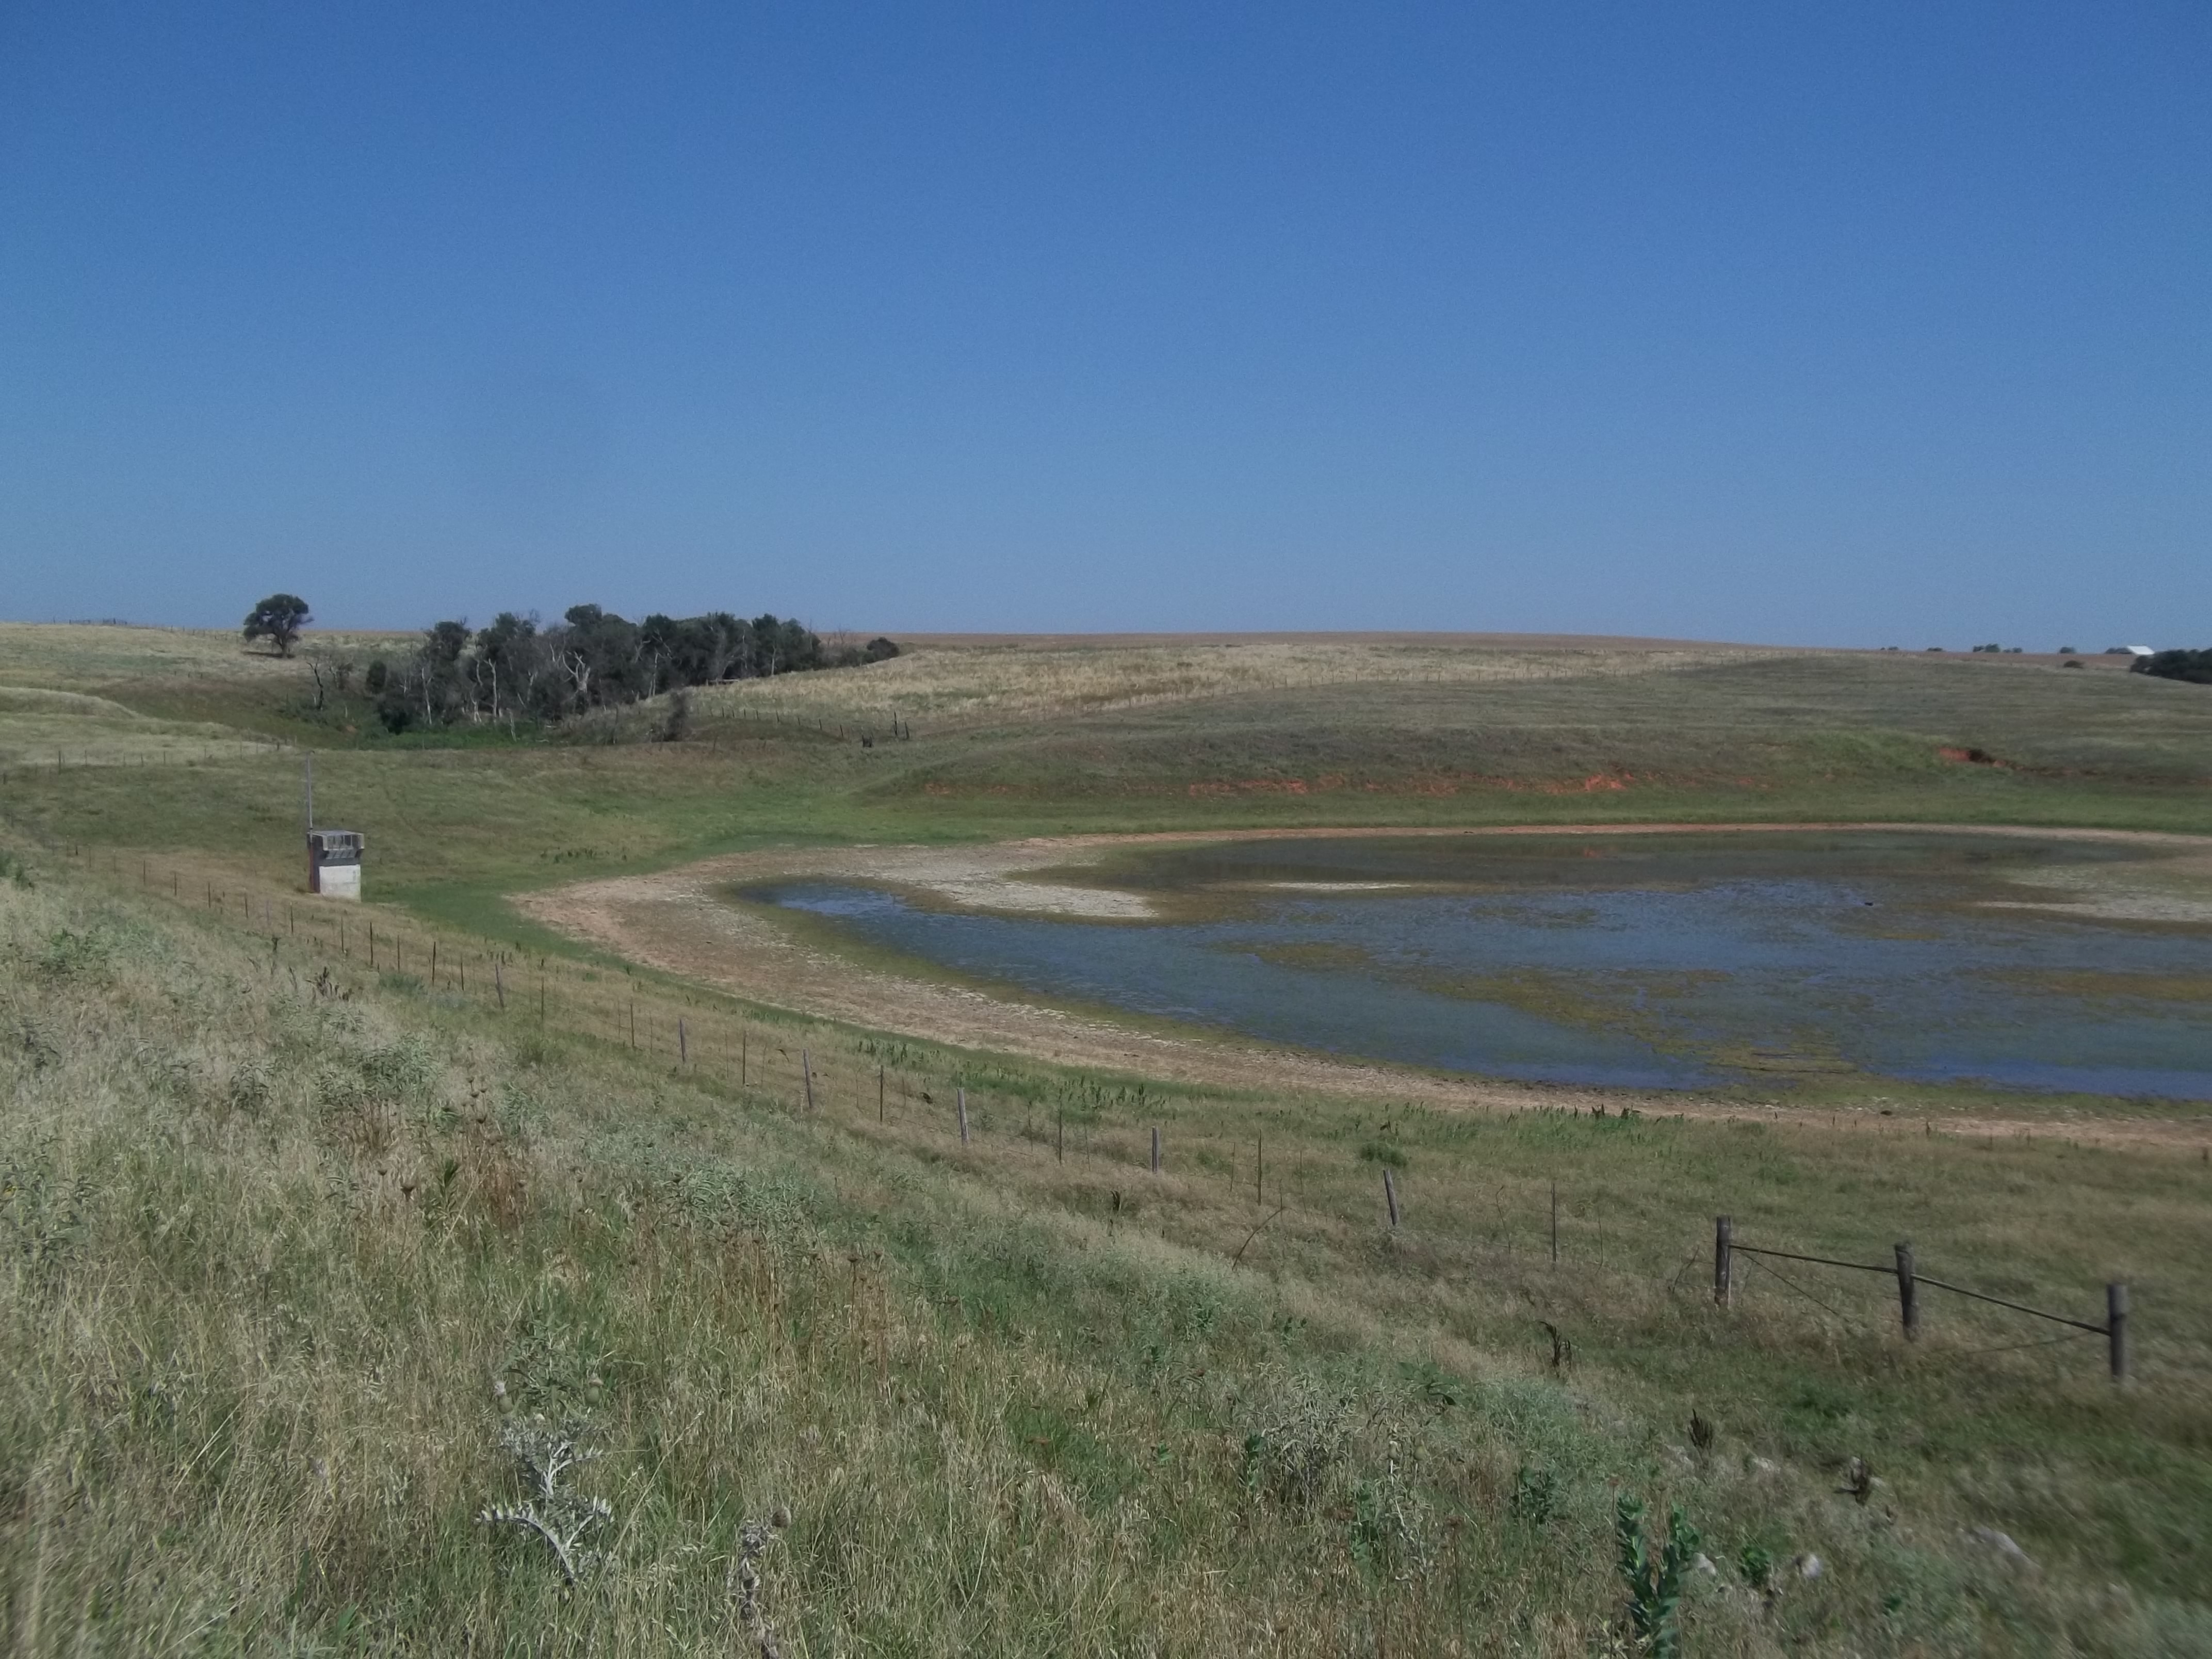
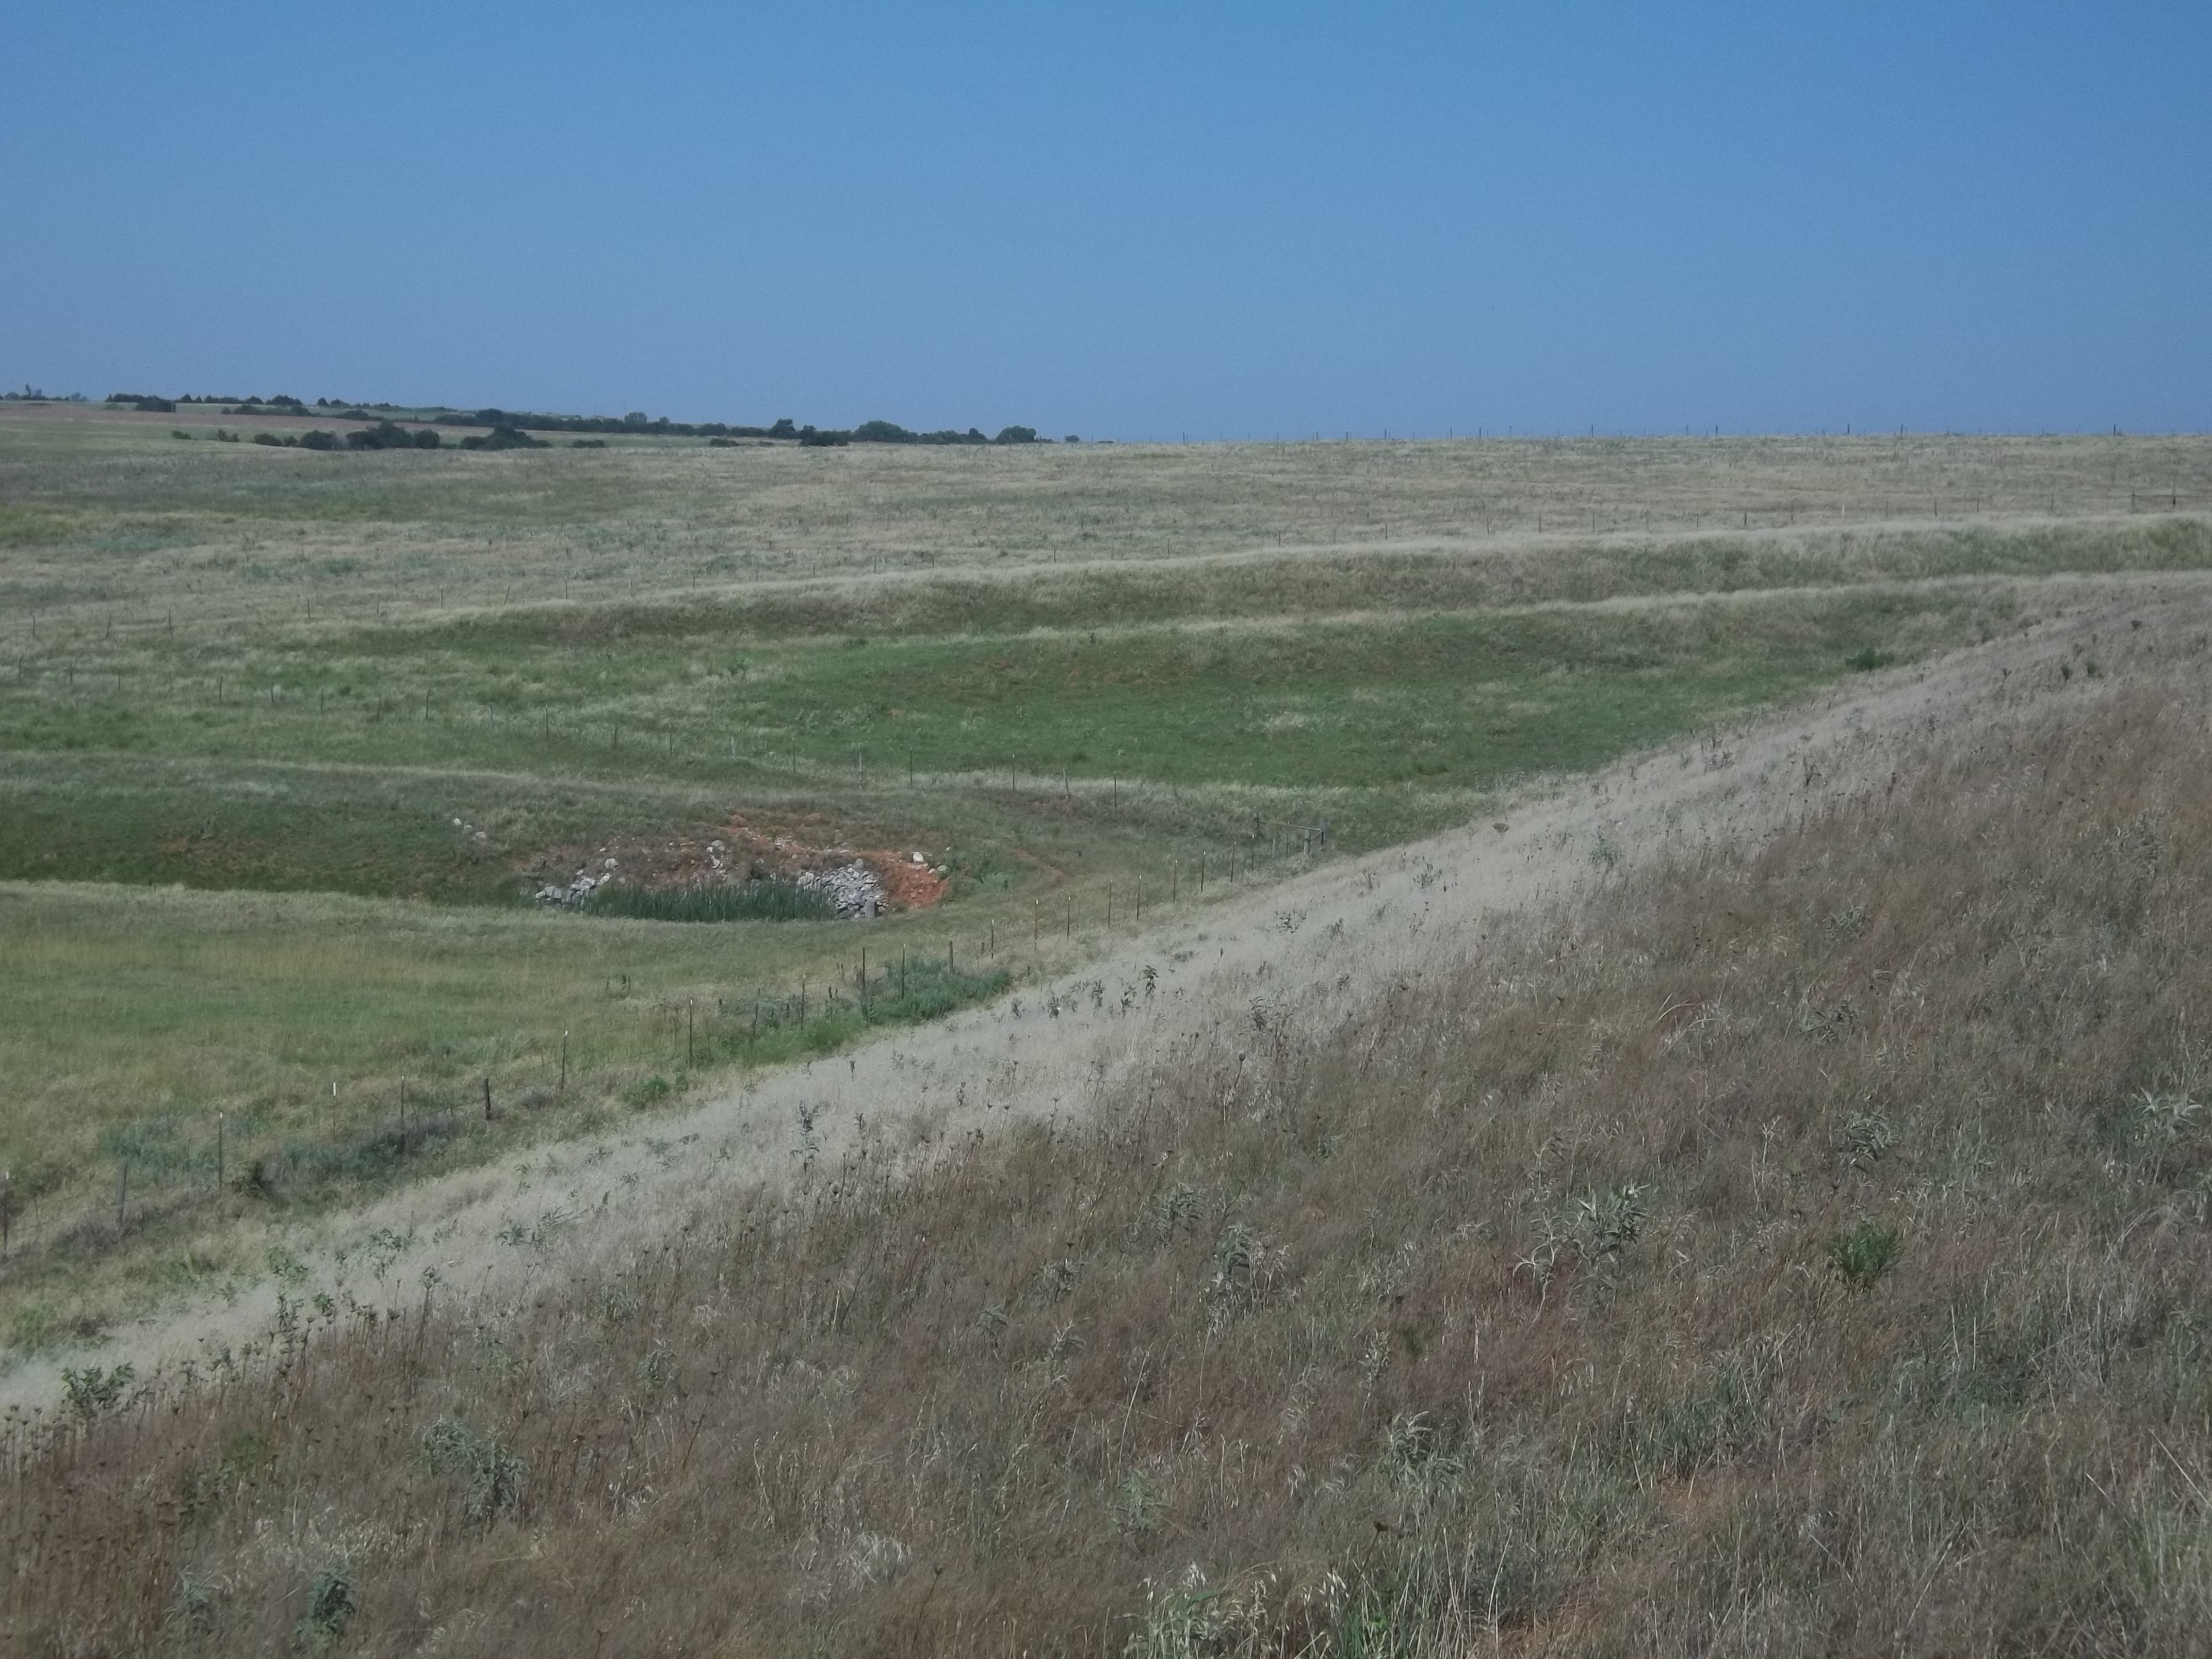
PICTURES FROM THE FIELD
Here are a few pictures sent to us by county officials. They represent
conditions we received from across the state of damaged crops, flagging stock
ponds and reservoirs and dead, crunchy natural grasses.
Greer County pictures (courtesy Greer County Conservation District)
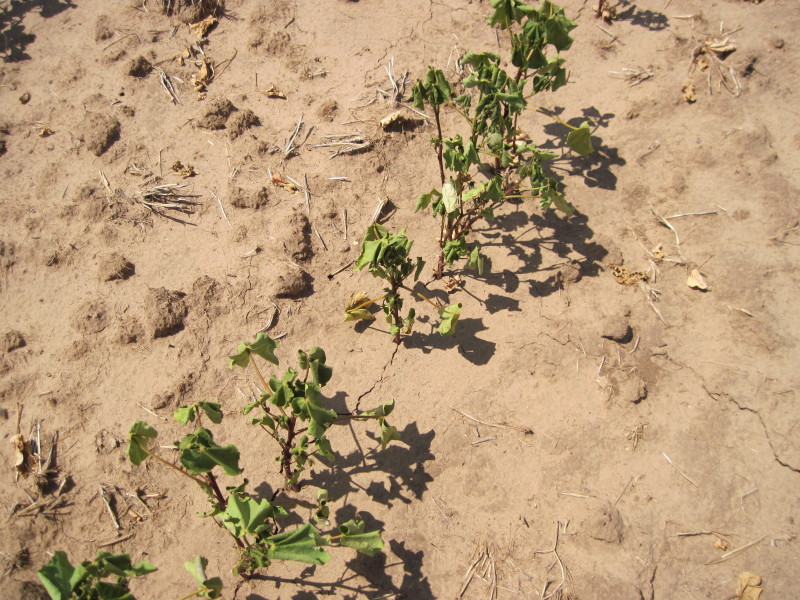
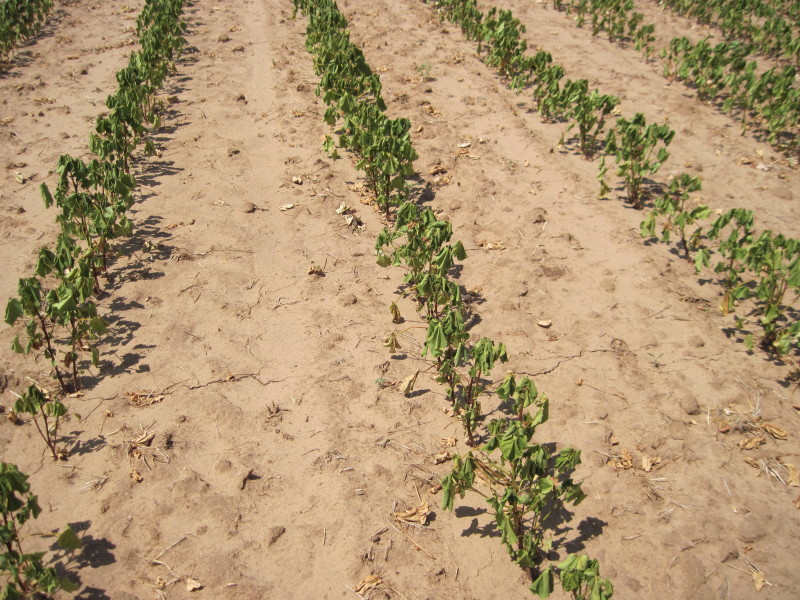
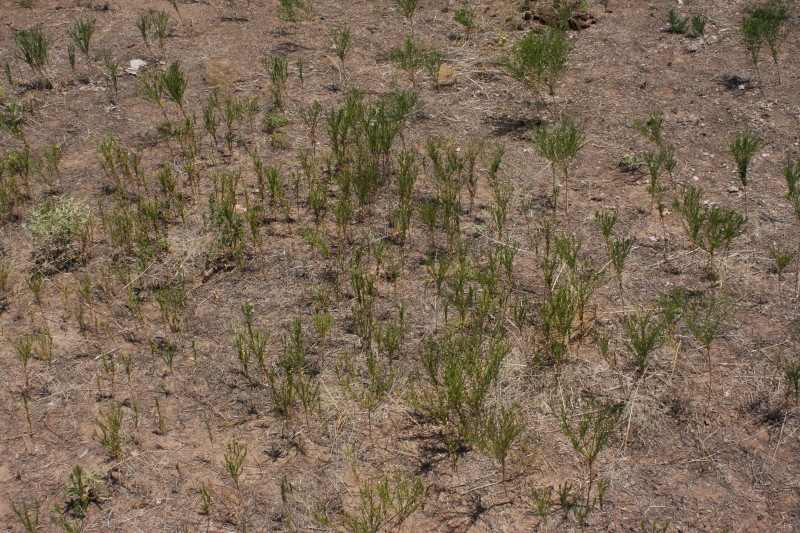
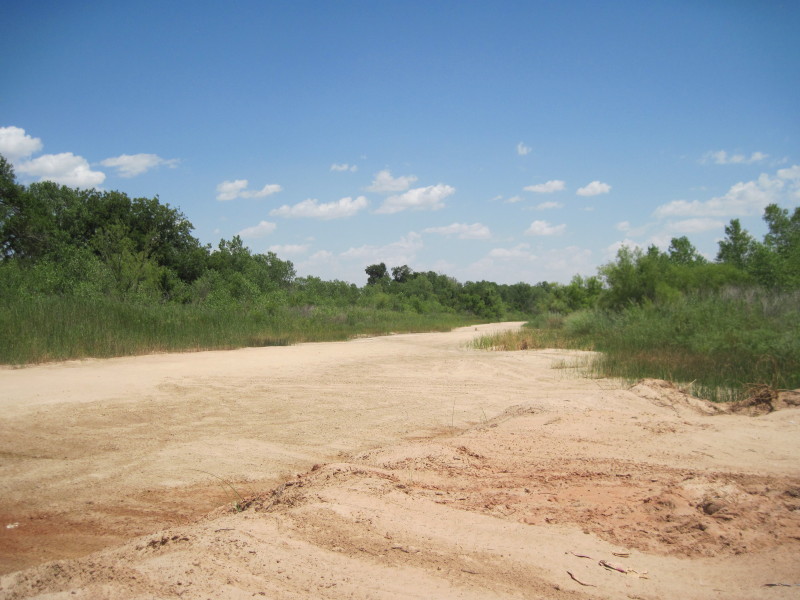
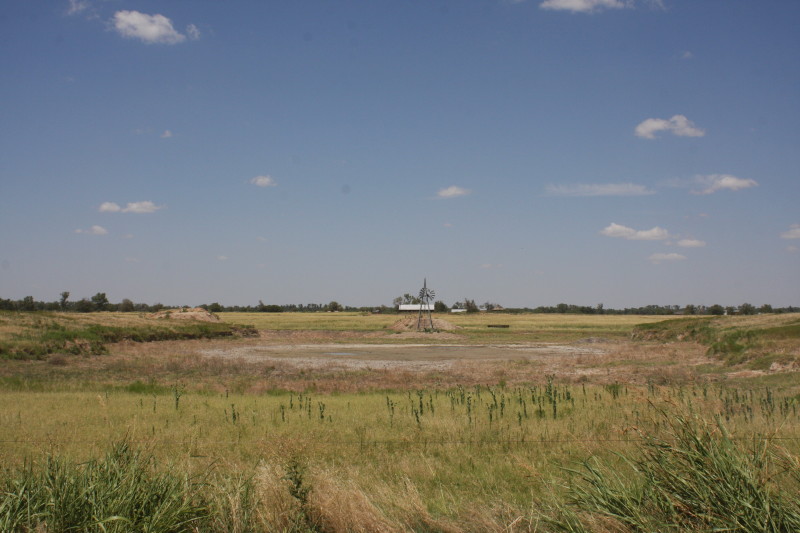
Canadian County pictures (courtesy Central North Canadian River Cons. District)
Gary McManus
Associate State Climatologist
Oklahoma Climatological Survey
(405) 325-2253
gmcmanus@mesonet.org
July 26 in Mesonet History
| Record | Value | Station | Year |
|---|---|---|---|
| Maximum Temperature | 111°F | HOLL | 2011 |
| Minimum Temperature | 50°F | CAMA | 2004 |
| Maximum Rainfall | 5.09″ | BROK | 2013 |
Mesonet records begin in 1994.
Search by Date
If you're a bit off, don't worry, because just like horseshoes, “almost” counts on the Ticker website!