Ticker for July 22, 2011
MESONET TICKER ... MESONET TICKER ... MESONET TICKER ... MESONET TICKER ...
July 22, 2011      July 22, 2011      July 22, 2011      July 22, 2011


A double-whammy for agriculture in 2011

Faithful Ticker reader Eric Hunt of the University of Nebraska-Lincoln sent us
some fascinating - and depressing - graphics a couple of days ago so I thought I
would share them with you. Oklahoma agricultural producers are obviously having
a tough go of it this year thanks to the drought. Eric has captured that by
looking at the percentages of the wheat and cotton crops rated "poor" or "very
poor" in the USDA's Weekly Weather and Crop Bulletins since 1989.

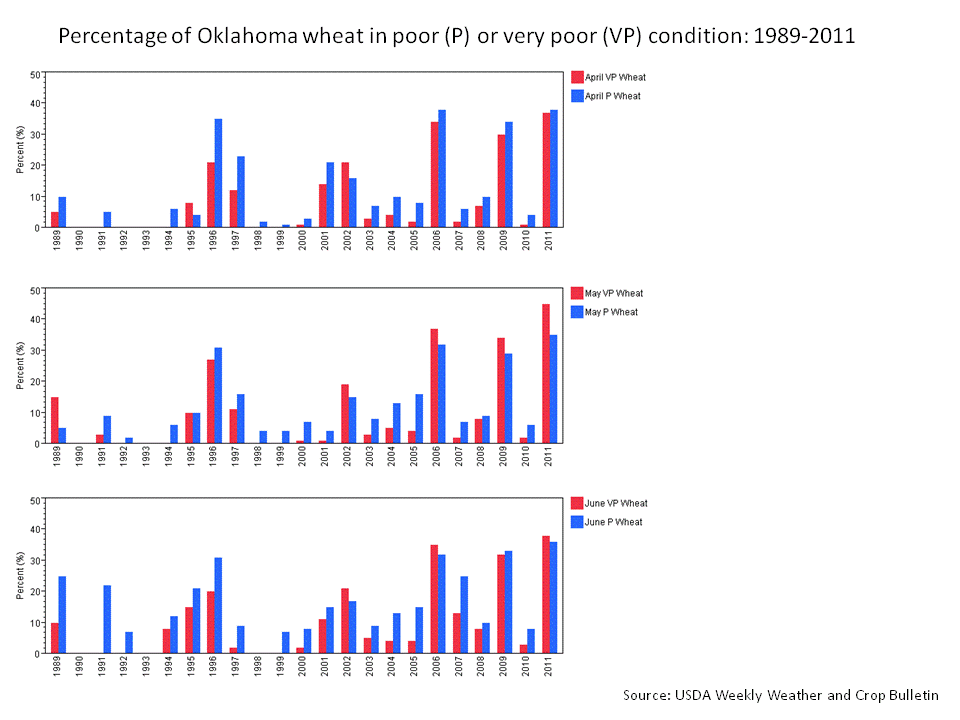
Now it's not that this is the first bad year for wheat. This first graphic showing
the percentages of Oklahoma's wheat crop rated poor or very poor in the last week
of April, May and June bears that out.


The droughts of the recent past stand out pretty well in 1996, 2002, 2006, 2009
and 2011 (a trend, perhaps?). The 2009 crop was actually affected by two freeze
events as well, so drought wasn't the only player there. The 2007 crop was also
an interesting case that had nothing to do with drought. Notice that for April
and May, the crop was doing wonderfully, coming back from a late freeze event
earlier that year. The problems arose when it started raining in June

(insert dramatic music here)

and
kept
raining.

By the time the rain had stopped much of the wheat crop had to be abandoned due
to disease and the inability to get the combines into the fields.

The crop this year was possibly the worst of all the bunch with relatively high
percentages of both poor and very poor ratings. This is well known, it was not
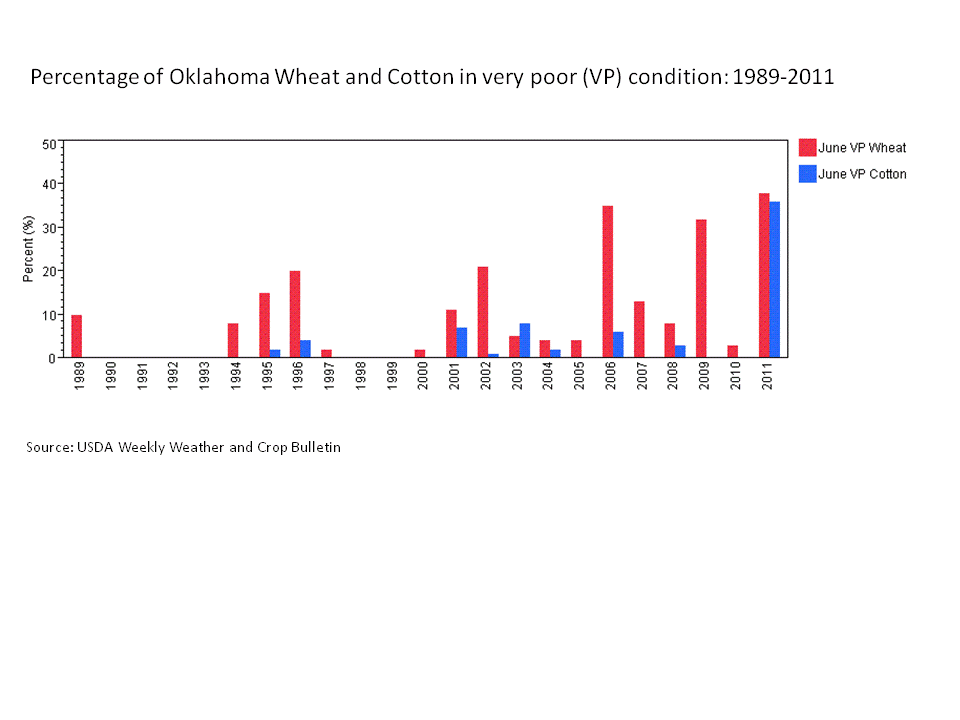
a bumper crop this year. This next graphic is the kicker (of this Ticker ...
nope, still not a poet!). Take a look at the percentage of Oklahoma wheat and
cotton rated in very poor condition in June since 1989.


Once again, the bad wheat crops show up pretty clearly. The cotton crops, at
least during June, have always been in pretty good shape prior to this year.
The double-whammy is evident in 2011, however. I'll quote Eric here:

"2011 is setting records (at least in this period of record) for the
percentage of wheat and cotton in poor and very poor condition. There
have been other years in this period where the wheat had problems (and
not always due to drought) but this is the first time in many years
that a very poor wheat crop has been followed by a very poor cotton
crop. 2006 was certainly not a good year but I don't think it will
hold a candle to this year in terms of yield reduction, as I highly
doubt the lack of rain and 100+ heat everyday this month is helping
the cotton."

Truer words have never been spoken, and yet another example of the precarious
business of making a living relying on Mother Nature.

Gary McManus
Associate State Climatologist
Oklahoma Climatological Survey
(405) 325-2253
gmcmanus@mesonet.org
July 22 in Mesonet History
| Record | Value | Station | Year |
|---|---|---|---|
| Maximum Temperature | 112°F | GRA2 | 2018 |
| Minimum Temperature | 56°F | GOOD | 2006 |
| Maximum Rainfall | 2.75″ | BEAV | 2015 |
Mesonet records begin in 1994.
Search by Date
If you're a bit off, don't worry, because just like horseshoes, “almost” counts on the Ticker website!