Ticker for September 20, 2012
MESONET TICKER ... MESONET TICKER ... MESONET TICKER ... MESONET TICKER ...
September 20, 2012 September 20, 2012 September 20, 2012 September 20, 2012
New drought map, same old colors
There were improvements for Oklahoma in this week's U.S. Drought Monitor map.
Going from exceptional to extreme drought IS a step in the right direction, sort
of like being upgraded from "critical" to "serious" in medical terms. The trouble
is, even at serious, you are still acutely ill. But again, at least it is some
improvement. The latest map shows those improvements in northeastern and west
central Oklahoma, but also includes a return to exceptional drought in
southwestern and central Oklahoma as well as the western Oklahoma Panhandle.
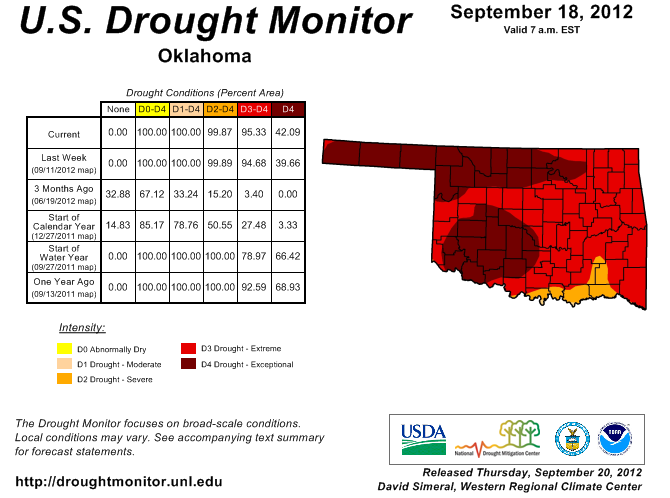
The result is a slight increase in the amount of Oklahoma covered by
exceptional (40% to 42%) and extreme-exceptional (94.7% to 95.3%) drought. The
entire state is still covered by severe-exceptional drought.
The drought remains anchored in the central Plains with the worst conditions
located in Nebraska, Kansas, Colorado, Oklahoma and Arkansas. Around 55% of
Nebraska, Kansas and Oklahoma remains in the exceptional drought category.
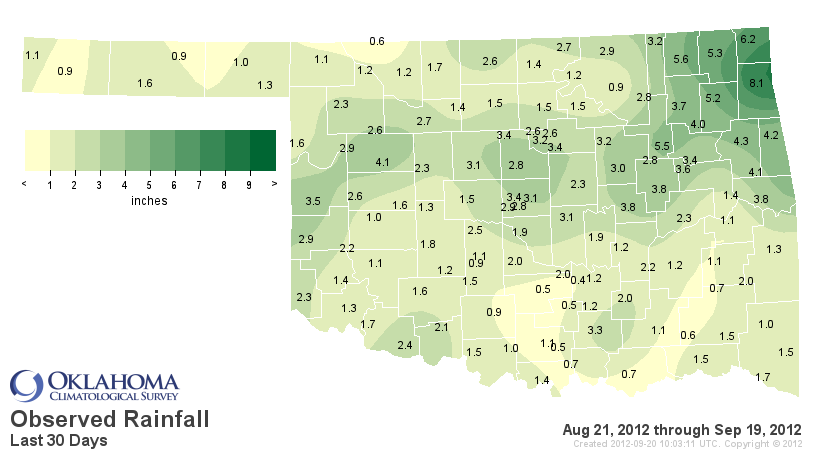
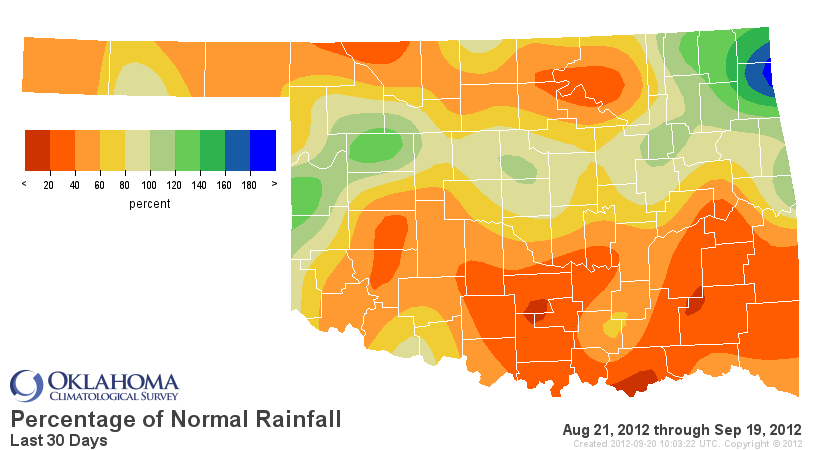
The changes to the Oklahoma map were made in response to our most recent rainfall
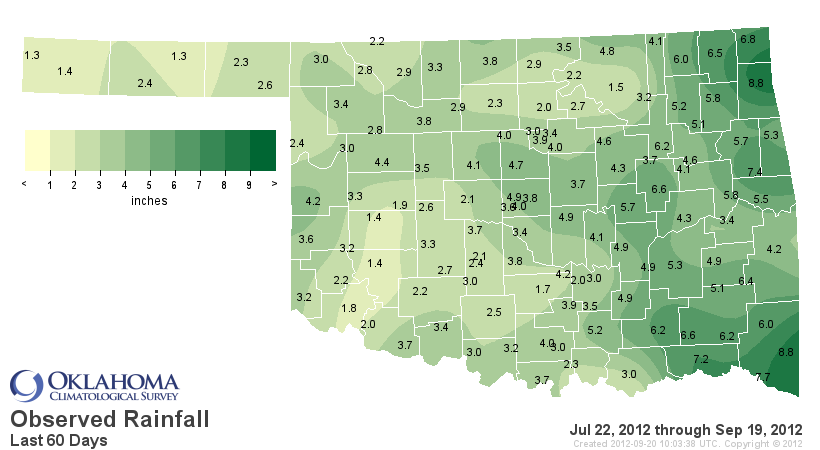
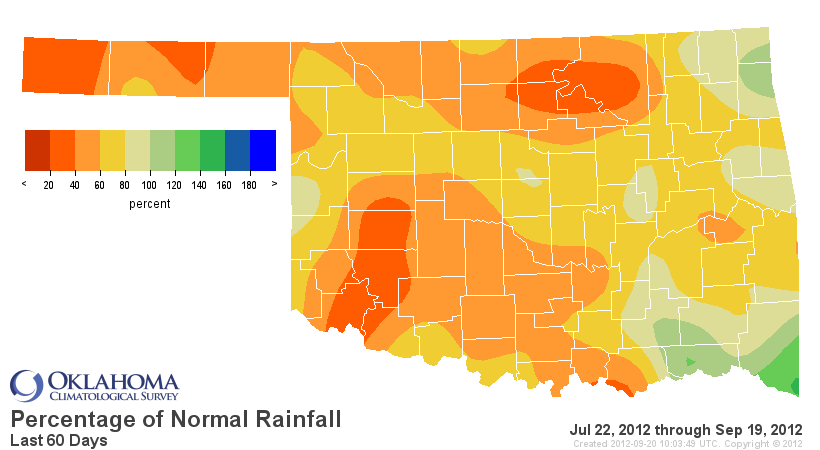
patterns. The 30-day and 60-day maps from the Oklahoma Mesonet show the story.
Too many areas with large deficits through the hottest part of summer right into
fall remain.
30-day Rainfall maps
60-day Rainfall maps
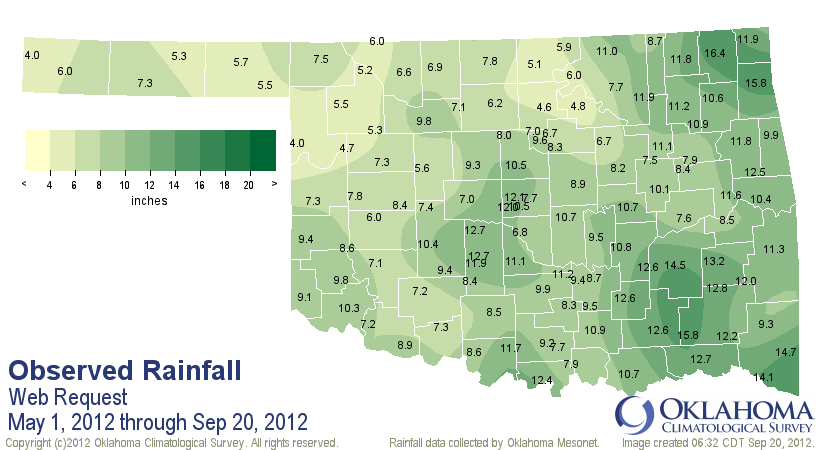
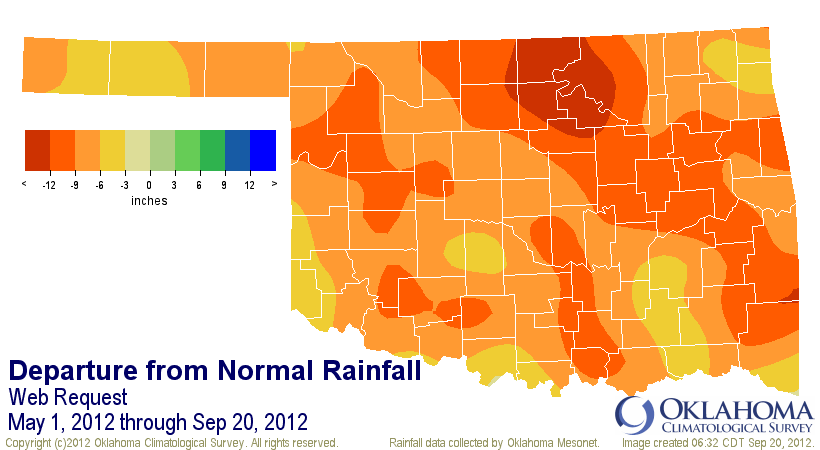
The longer term dryness serves as the backdrop, going back to May of this year
and encompassing most of Oklahoma's primary rainy season. The statewide average
since May 1 is 8.98 inches, 8.41 inches below normal and the driest such period
in Oklahoma dating back to at least 1921.
May 1-Sep. 20 Rainfall maps
And of course an even larger backdrop for this current drought is the two-year
drought wrapped around it.
Oct. 1, 2010-Sep. 20, 2012 Rainfall maps
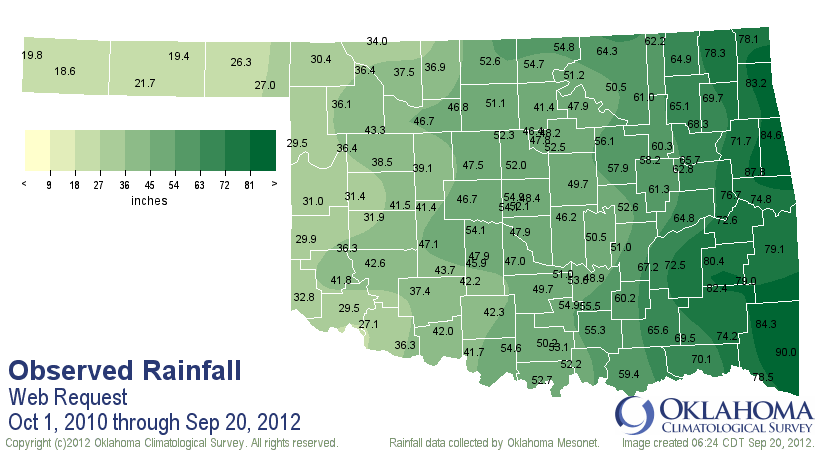
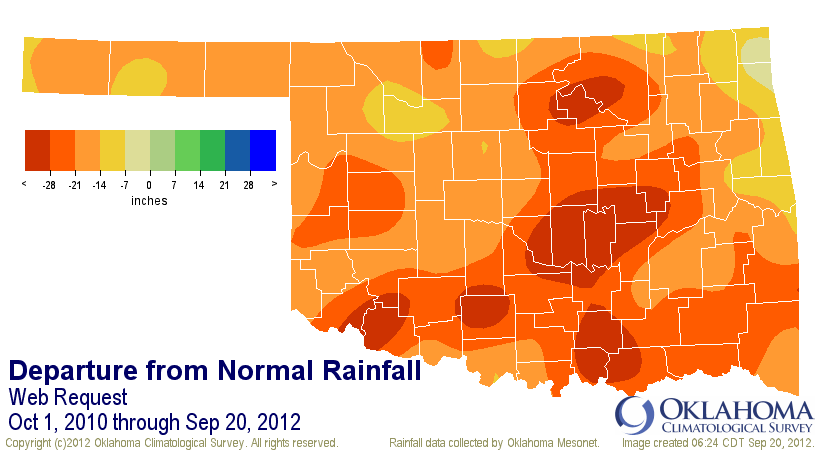
Parts of the state are more than 28 inches below normal since the drought's
genesis back in October 2010. The statewide average through that time is 50.7
inches, more than 21 inches below normal and just slightly wetter than the
driest such period on record from Oct. 1, 1954-Sep. 20, 1956.
I will repeat what I have said many times ... the 1930s and the 1950s are NOT
good company to keep, climatically (and climactically) speaking.
On the short term, chances for rain look pretty slim over the next five days.
After that, there is a hint of some moisture to our southwest, which means
eventually it could wind up here in Oklahoma. These maps from the NWS' Climate
Prediction Center (CPC) indicate probabilities for above-, below- or near-normal
precipitation amounts.
The CPC outlooks for October and the October-December period indicate increased
odds of above normal temperatures and no guidance on precipitation.
***CAUTION: The white "EC" areas on these maps do NOT indicate normal conditions
are favored. They are an indication that above-, below- or near-normal
conditions are equally likely.
CPC October outlooks
CPC October-December Outlooks
The latest U.S. Seasonal Drought Outlook is fairly pessimistic for the western
two-thirds of the state over the next three months, but the eastern third of
the state will see some hopes of improvement (with drought still ongoing).
Their reasoning follows:
"According to the USDM, extreme to exceptional drought covers nearly
all of Oklahoma with varying drought intensity across Texas. A
relatively dry climatology favors persistence across western Oklahoma
and the Texas Panhandle. Prospects for some improvement increase across
the southern half of Texas where climatologically, conditions do not
become drier during OND, and the CPC monthly/seasonal outlooks
indicate a tilt in the odds towards above median precipitation. El
Nino precipitation composites indicating above median precipitation
across south Texas are also considered."
Gary McManus
Associate State Climatologist
Oklahoma Climatological Survey
(405) 325-2253
September 20 in Mesonet History
| Record | Value | Station | Year |
|---|---|---|---|
| Maximum Temperature | 107°F | FREE | 2024 |
| Minimum Temperature | 41°F | NOWA | 2003 |
| Maximum Rainfall | 5.83 inches | MTHE | 2019 |
Mesonet records begin in 1994.
Search by Date
If you're a bit off, don't worry, because just like horseshoes, “almost” counts on the Ticker website!