Ticker for July 17, 2012
MESONET TICKER ... MESONET TICKER ... MESONET TICKER ... MESONET TICKER ...
July 17, 2012 July 17, 2012 July 17, 2012 July 17, 2012
Hey cops, want doughnuts?
Hopefully there are a few other Bob and Doug McKenzie fans out there that will
recognize that quip, lest I get in trouble with our fine men and women of law
enforcement. But I don't need help from those two hosers to show what's been
going on with our precipitation chances lately. Here is the 5-day rain forecast
from the HPC, and this is what it's looked like for most of the summer with
Oklahoma mired in the doughnut hole.
That's the typical pattern you see during Oklahoma when an upper-level ridge sets
up, with precipitation ringing the fringes of that ridge. And that's the type of
pattern that allows the drought/extreme heat feedback loop to set up quite nicely.
The dry ground and dead/dormant vegetation waits patiently for a nice dome of
sinking air to settle in over it and the heat is on. And then the drought is on,
and so on and so forth. We've talked about that a million and one times on the
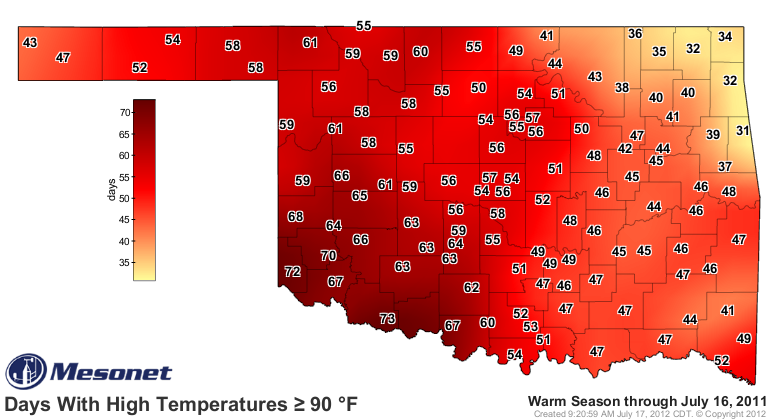
Ticker, and only need to point to the Mesonet days above 100 and 90 degrees maps
as an example. Quick, find the worst drought areas!
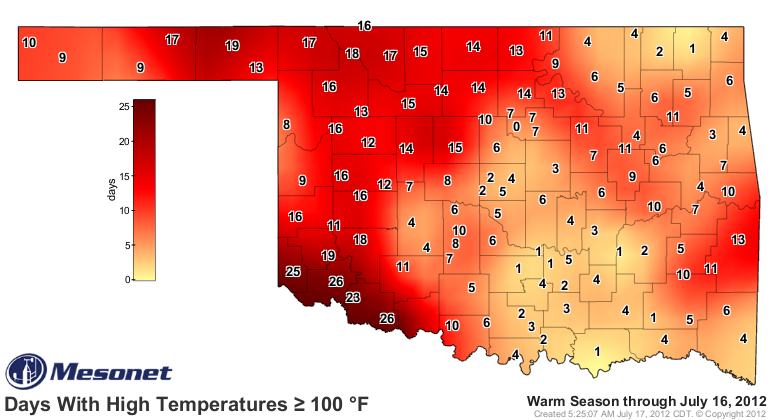
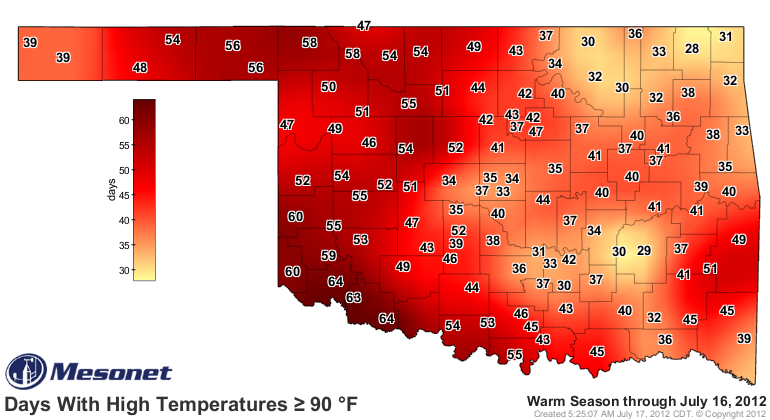
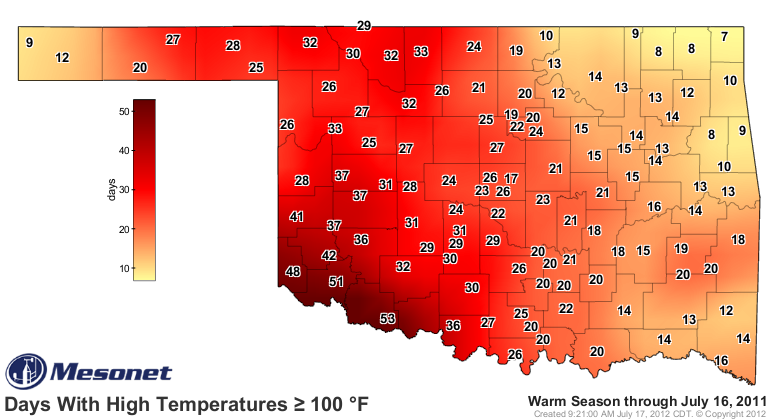
For a pick-me-up, here's a "hey, it's not as bad as last year" reminder ... the
same maps for last year through July 16.
---------------------------------------------------------------------------------
The view from space
Some of you on social media might have seen this image from NASA yesterday or
today, but it's an excellent representation of where the drought is taking its
toll on vegetation. This is an extremely large picture, so give it a sec when
you click on it.
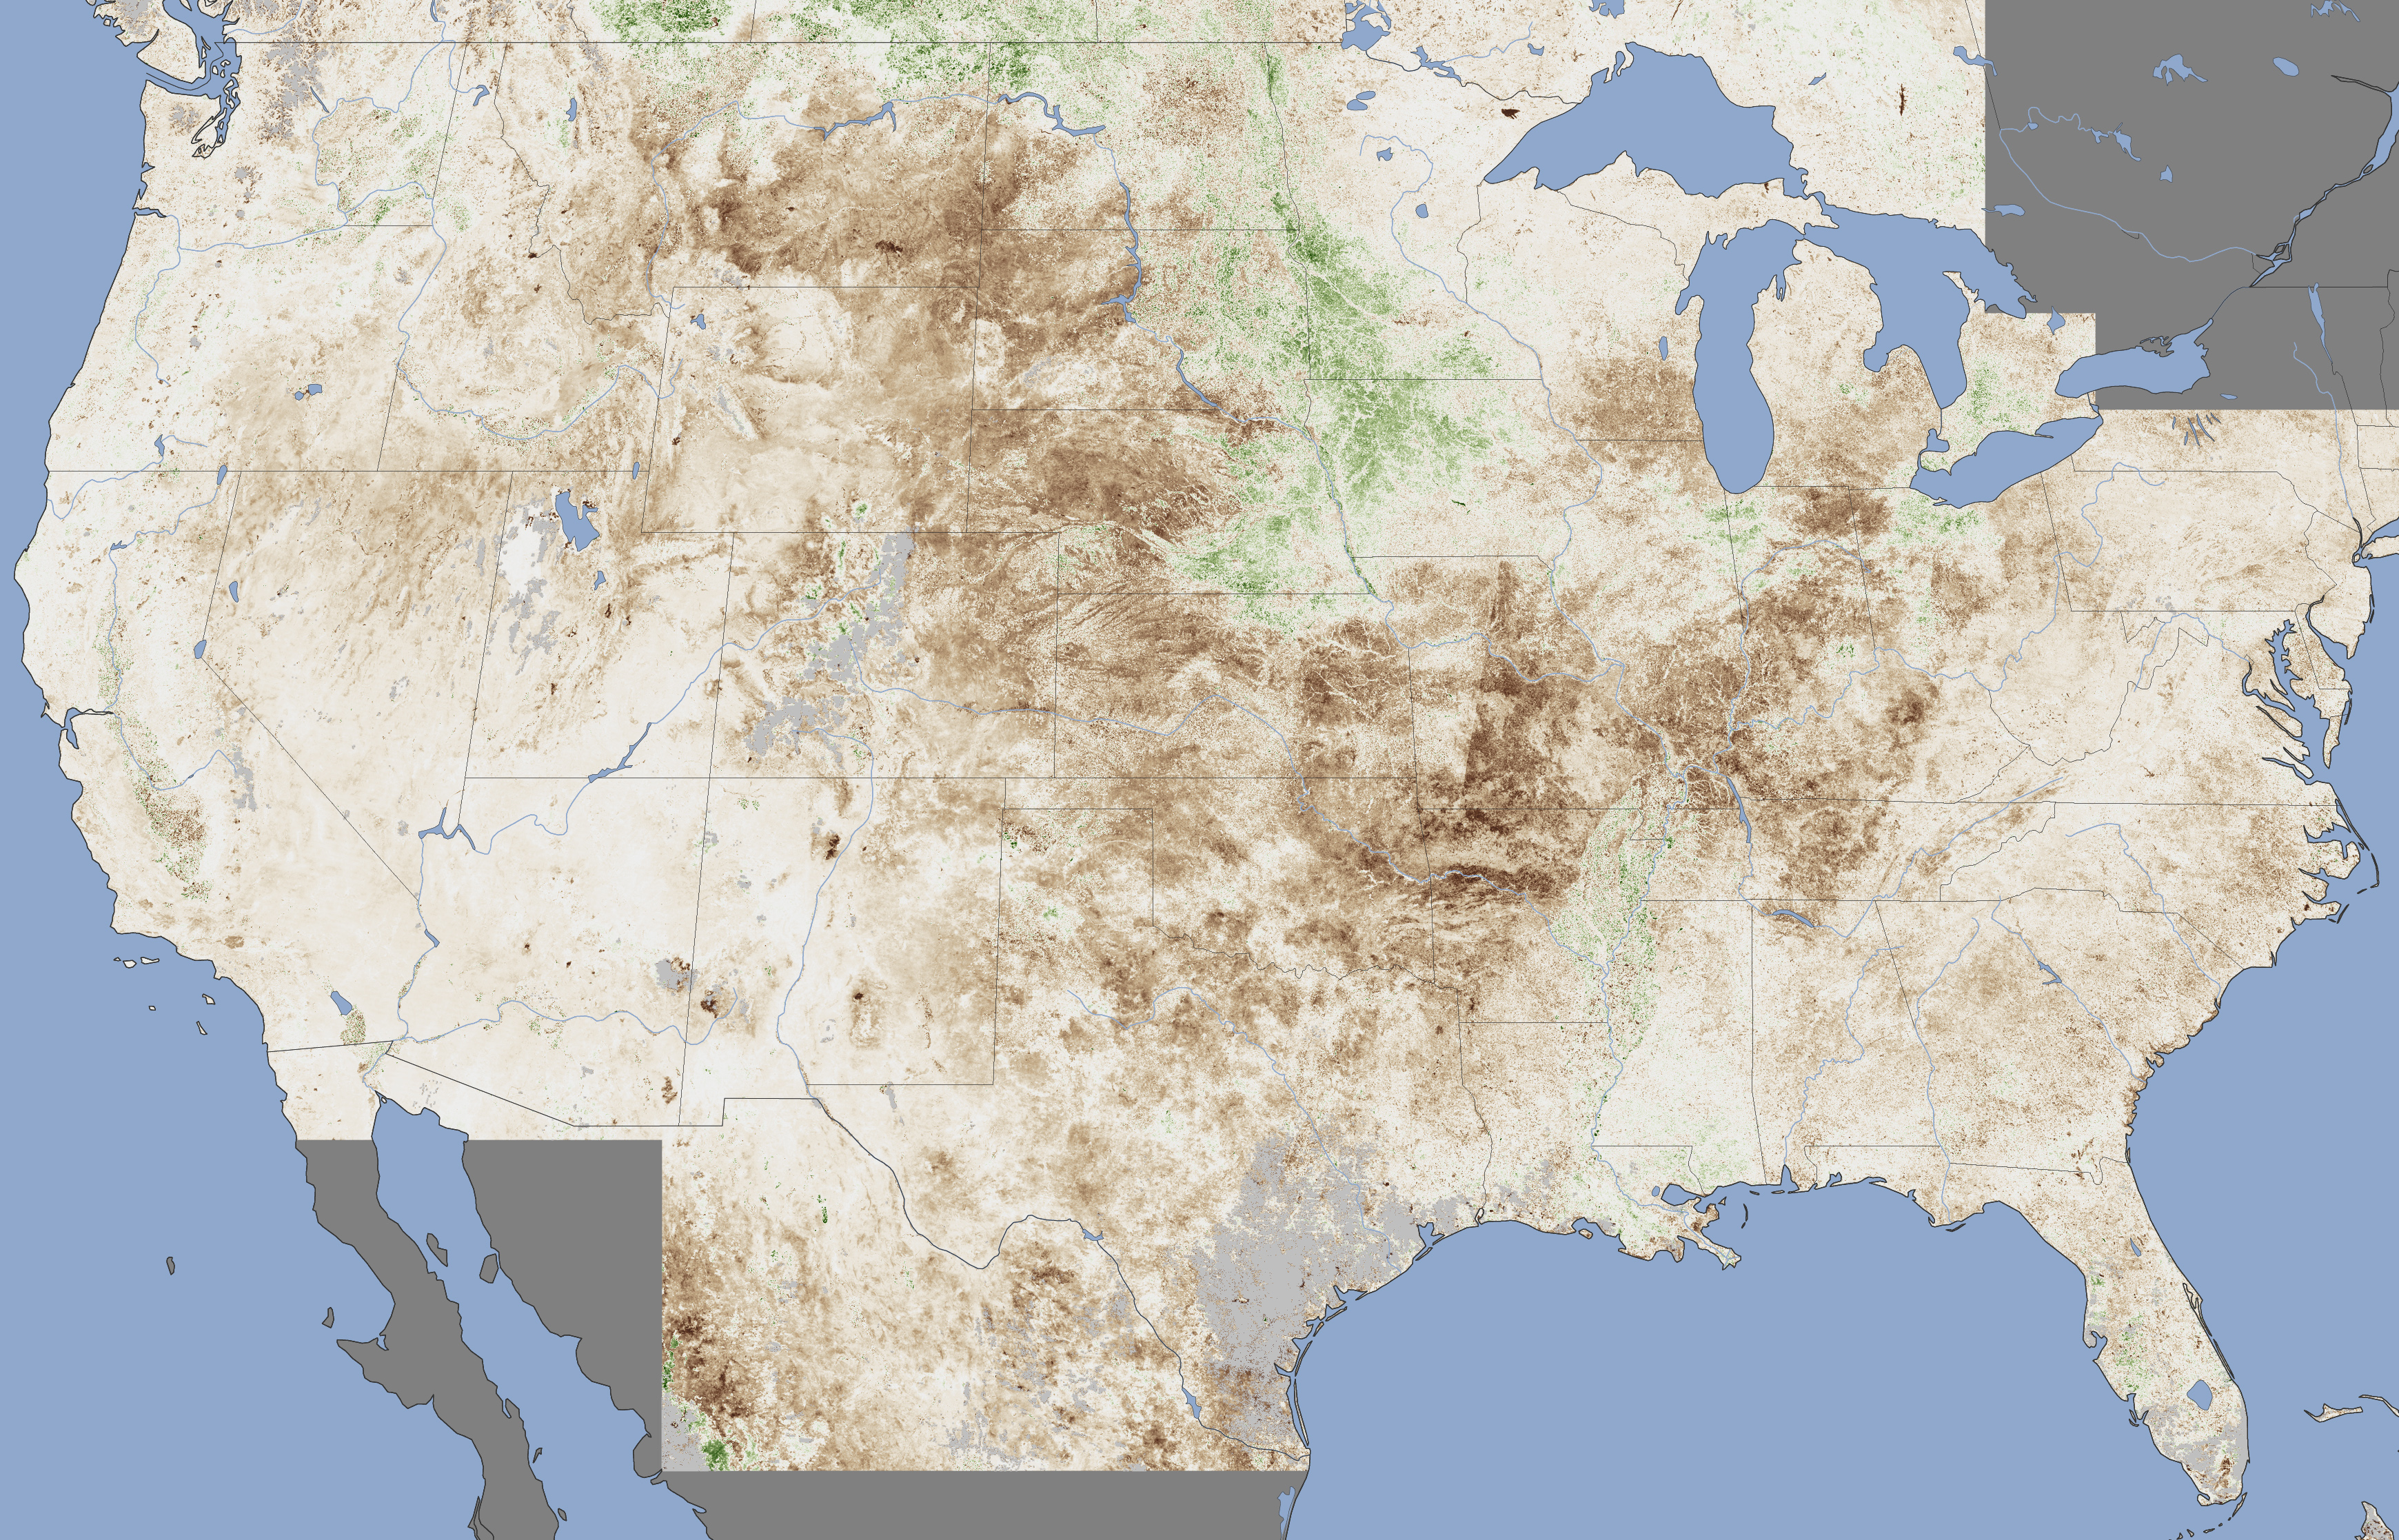
The color scheme is obvious, with brown being bad and green being good. Here's a
bit of explanation:
"Farmers across the United States hoped for rain in July 2012 as a drought of
historic proportions parched key commodity crops, including corn, soybeans,
and wheat. On July 11, the United States Department of Agriculture announced
that more than 1,000 counties in 26 states qualified as natural disaster
areas?the largest total area ever declared a disaster zone by the agency.
The extent of the damage to crops is depicted in this vegetation anomaly map
based on data from the Moderate Resolution Imaging Spectroradiometer (MODIS)
on NASA?s Terra satellite. The map contrasts plant health in the central
United States between June 25 and July 10, 2012, against the average
conditions between 2002 and 2012. Brown areas show where plant growth was
less vigorous than normal; cream colors depict normal levels of growth; and
green indicates abnormally lush vegetation. Data was not available in the
gray areas due to snow or cloud cover. The image is based on the Normalized
Difference Vegetation Index (NDVI), a measure of how much plant leaves absorb
visible light and reflect infrared light. Drought-stressed vegetation reflects
more visible light and less infrared than healthy vegetation.
The most severe damage to crops appears to be centered on Missouri, Arkansas,
Oklahoma, Texas, Kansas, Nebraska, and South Dakota. Crops in much of the
upper Midwest?southern Wisconsin, Michigan, Indiana, southern Illinois,
western Kentucky, and western Tennessee?also show signs of strain. States in
the Mountain West that are in the midst of a busy wildfire season?Montana,
Wyoming, and Colorado?have also experienced marked declines in the health of
vegetation. The drought has been less severe in Iowa, a key corn-growing
state."
From this view, obvious areas of concern show up in east central Oklahoma,
an extension of current hardest hit ares in the northwestern half of Arkansas.
That is the drought creepage that I've been describing for the past couple of
months. Last year it crept in from the west (where it really has been a
continuous multi-year drought dating back to October 2010) and this year its
intensifying westward from the east. We have been hearing very bad reports
from the Muskogee area down towards the southeast. Lest we leave western Oklahoma
out, the reports from out around Roger Mills County and surrounding areas are
very similar to last year.
---------------------------------------------------------------------------------
It's not as bad as last year, part 2
Let's compare the statewide average temperatures for the June 1-July 16 periods
from last year and this year. The difference is remarkable. And while this year
has been somewhat hot at times, it ain't nothing compared to last year.
-****-
Statewide average temperatures, June 1-July 16, 2012 vs. 2011
TMax TMin TAvg
2012 93.6 67.9 80.8
2011 98.9 71.6 85.2
Normal 90.0 66.5 78.3
2011-2012 5.3 3.7 4.5
-***-
The average high temperatures in west central and southwestern Oklahoma through
that period last year were 101.5 degrees and 102.9 degrees, respectively, vs.
94.9 degrees and 95.1 degrees, again respectively ... an incredible 6-8 degree
difference.
It's a very telling statement when you declare a month and a half stretch of
summer that's "only" 2.5 degrees above normal as being "not so bad."
And hey, it's only a couple of months until Fall. That's not so bad.
Gary McManus
Associate State Climatologist
Oklahoma Climatological Survey
(405) 325-2253
gmcmanus@mesonet.org
July 17 in Mesonet History
| Record | Value | Station | Year |
|---|---|---|---|
| Maximum Temperature | 111°F | HOLL | 2022 |
| Minimum Temperature | 54°F | KENT | 2009 |
| Maximum Rainfall | 6.42″ | BURB | 1997 |
Mesonet records begin in 1994.
Search by Date
If you're a bit off, don't worry, because just like horseshoes, “almost” counts on the Ticker website!