Ticker for July 13, 2012
MESONET TICKER ... MESONET TICKER ... MESONET TICKER ... MESONET TICKER ...
July 13, 2012 July 13, 2012 July 13, 2012 July 13, 2012
More on drought
And be careful how you pronounce that title or I might get offended. Or
identified! We know that drought is building in Oklahoma, and in most cases, not
as severe as what it was last year. In that respect, we have to be sure to give
voice to those who actually are worse off than last year.
On to the point, however, besides the one on top of my head. The drought across
much of the rest of the nation has prompted the USDA to declare 1000 counties
across 26 states as disaster areas, becoming the "largest" natural disaster
declaration in American history.
https://content.mesonet.org/ticker/archive/20120713/disaster-fast-track-2012.pdf
The "largest" claim is an artifact of the new rules that allowed for this
declaration. Those new rules are detailed in the USDA's press release, found
here. Surely the drought of the 1930s, 1950s, and maybe even 1988 would be
impressive in scope under these rules.
http://www.usda.gov/wps/portal/usda/usdahome?contentid=2012/07/0228.xml&contentidonly=true
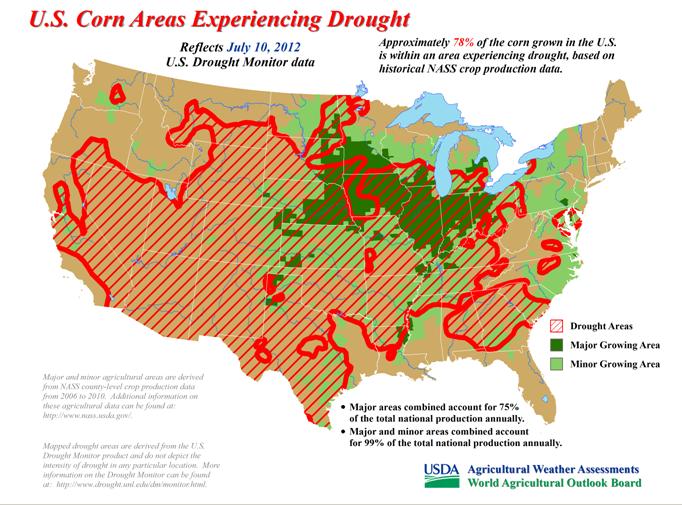
As you can see from this graphic from the USDA, 78% of the corn grown in the U.S. is
within an area experiencing drought.
Reports from our own neck of the woods in eastern Oklahoma indicate non-irrigated corn
is suffering. I would suspect that other areas of the state are also having problems
with their crop. Luckily, we made it to harvest before the drought disaster-ified the
Oklahoma wheat crop. We are getting reports from both eastern and western Oklahoma
of dry farm ponds and cattle producer hauling water, with the possibility of further
herd reduction from last year possible.
A telling graphic here, from the USGS' National Inter-Agency Fire Center ... this is
a map of the departure from average greenness for the week of July 3-9. portray how
green each pixel is compared to its average greenness for the current week of the year
based on 1989-2003 data. The color scheme is obvious, green is greener than average,
brown is less green than average.
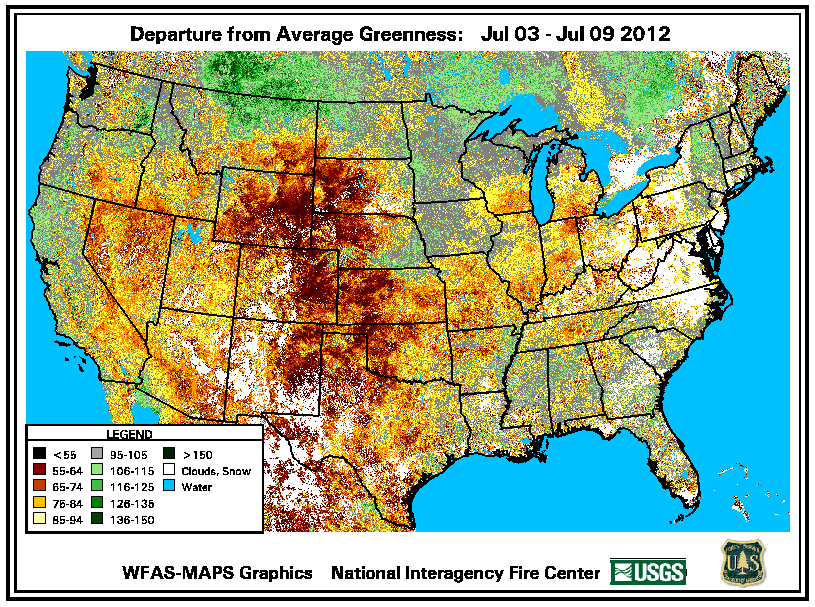
Not really a shock at how that map matches up with the national Drought Monitor map.
So the drought's not as bad as last year for a lot of the state, but for some of our
fellow Okies, it's as bad or even worse. Always important to keep that in mind. And for
drought in the rest of the country, especially the corn belt, it may seem like somebody
else's problem. But again, if you eat, it will soon be your problem as well. Corn prices
affect just about everything, from food additives to ethanol to feed for cattle and
chickens.
Gary McManus
Associate State Climatologist
Oklahoma Climatological Survey
(405) 325-2253
gmcmanus@mesonet.org
July 13 in Mesonet History
| Record | Value | Station | Year |
|---|---|---|---|
| Maximum Temperature | 109°F | LAHO | 2003 |
| Minimum Temperature | 52°F | BOIS | 2008 |
| Maximum Rainfall | 4.29″ | CLAY | 2025 |
Mesonet records begin in 1994.
Search by Date
If you're a bit off, don't worry, because just like horseshoes, “almost” counts on the Ticker website!