Ticker for September 22, 2021
MESONET TICKER ... MESONET TICKER ... MESONET TICKER ... MESONET TICKER ...
September 22, 2021 September 22, 2021 September 22, 2021 September 22, 2021
PICK A LANE!
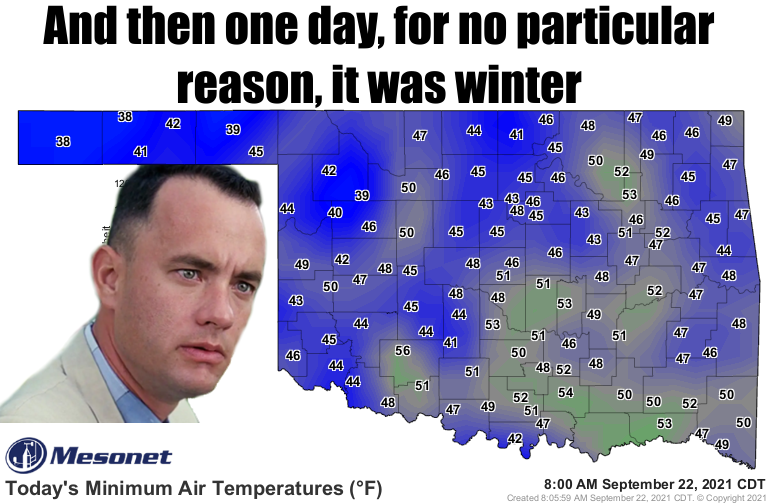
Okay, a bit of hyperbole there...how about late fall? Late October/early November?
What do you expect when we spot the first 30s in the state since last May? May
13, to be exact, when it got down to 36 in Eva, as well as some other 30s across
northern OK. Our first fall freeze is POSSIBLY right around the corner, but as
it turns out, not quite the next corner, or possibly even the next one. After our
brief foray into fall, we're right back to summer in a couple of days with upper
80s and 90s forecast for highs.
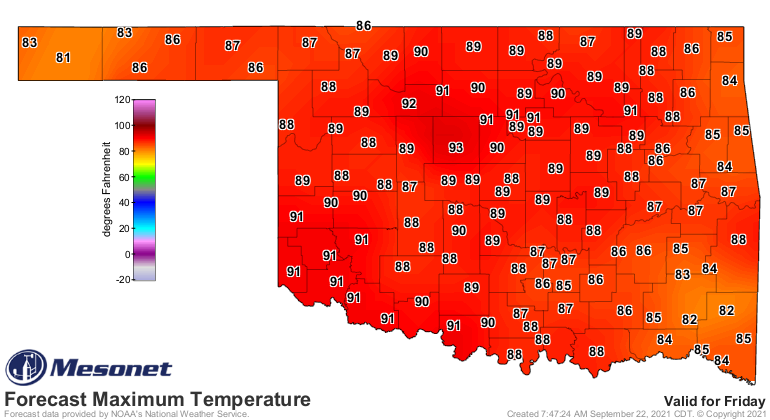
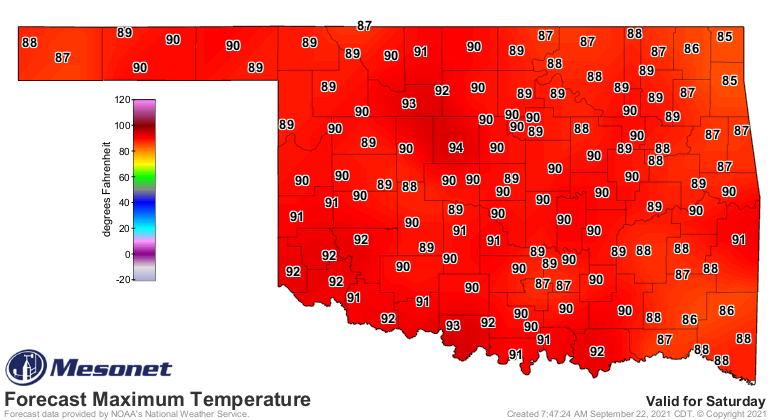

And that type of weather could continue well into October, it appears, although
even with this type of outlook you can't discount a stray front and cool down
here or there. *I* could discount it, but I'm too lazy.
Oh, and forget the rain, too. That's the real sad part of our weather pattern.
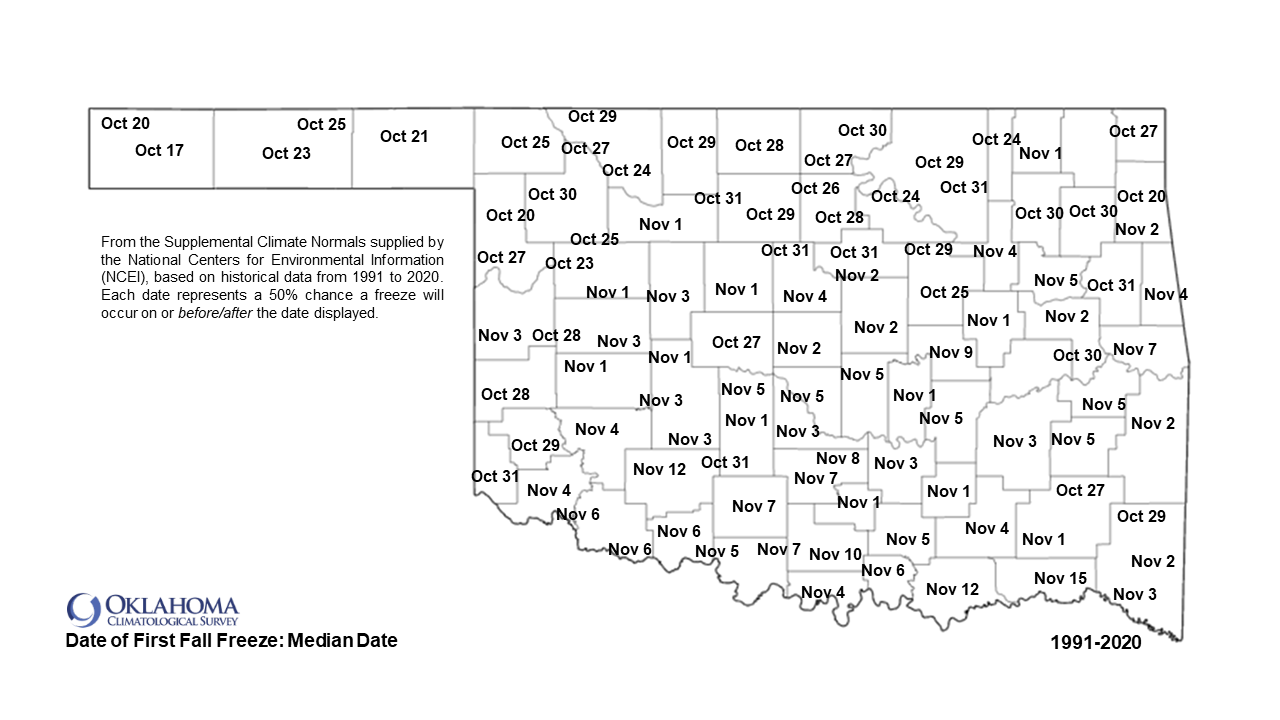
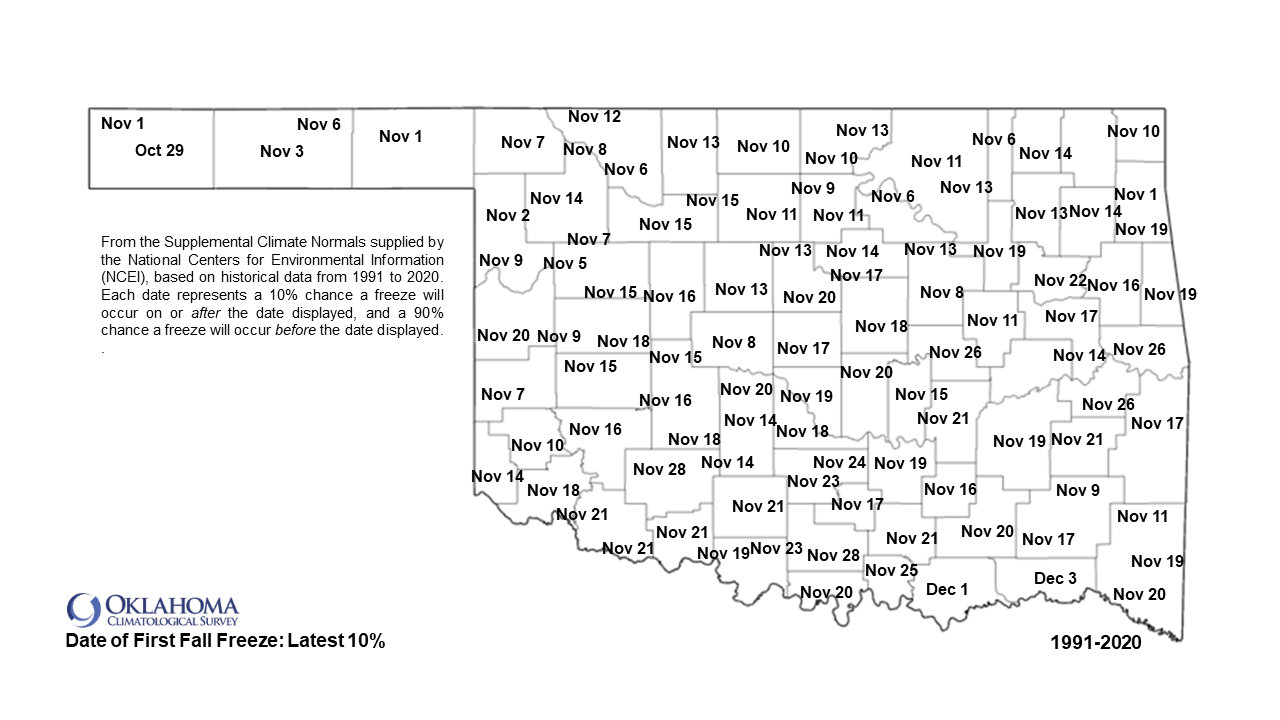
We've updated the potential first-freeze-of-fall maps with the newest normals
from NCEI. These run from 1991-2020, so they're fresh with the latest climate
happenings around the Southern Plains. We've plotted the dates for the earliest
10%, the median date (50%), and the latest 10%. In other words, the dates on
the earliest 10% map indicate a 10% chance of a freeze happening on or BEFORE
that date (or a 90% chance the first freeze would occur AFTER that date). The
median date is obviously a 50% chance the first freeze would occur on or
either before or after that date, and then the latest 10% shows the date on
which you could expect a 10% chance that first freeze would occur on or AFTER
the date displayed (or 90% chance on or BEFORE).
GASP GASP!
I hope I explained that correctly. I tried to think but nothing happened, so
I'll just throw caution to the wind and go for it. Here are the maps.

Obviously those dates are looking from a distance. When you get closer, like
for the earliest 10% maps, maybe we can start to push those dates forward a bit
given the current and expected weather pattern? In other words, while these
maps represent the percentages based on the normals, we have to start to take
day-to-day weather into account as we approach the cool season. So Boise City
has a 10% chance of a freeze by October 4, but maybe a bit later this year?
At any rate, we're still a few weeks away for most of the state to see those
freeze chances start to go up, but nothing would shock us this year.
Gary McManus
State Climatologist
Oklahoma Mesonet
Oklahoma Climatological Survey
(405) 325-2253
gmcmanus@mesonet.org
September 22 in Mesonet History
| Record | Value | Station | Year |
|---|---|---|---|
| Maximum Temperature | 102°F | HOLL | 2023 |
| Minimum Temperature | 36°F | EVAX | 2018 |
| Maximum Rainfall | 7.63″ | SEIL | 1997 |
Mesonet records begin in 1994.
Search by Date
If you're a bit off, don't worry, because just like horseshoes, “almost” counts on the Ticker website!