Ticker for June 30, 2008
MESONET TICKER ... MESONET TICKER ... MESONET TICKER ... MESONET TICKER ...
June 30, 2008      June 30, 2008      June 30, 2008      June 30, 2008


Why do the Trees Stop at I-35?

Another question from our Big Hopper of Ticker Requests:

"Why is there a vegetation (and thus presumably a climate)
change about 50 miles west of Tulsa?"

Great question. It's asked quite often, as there is a noticeable
break in tree density as one moves east-to-west in our state.
Some people use I-35 as the tipping point between "lots of trees"
and "not so many trees".

There are surely several components to the answer, depending on whose
lens you're employing (a biologist's, a geologist's, etc.). However,
from a climate sense, the answer lies in water availability.

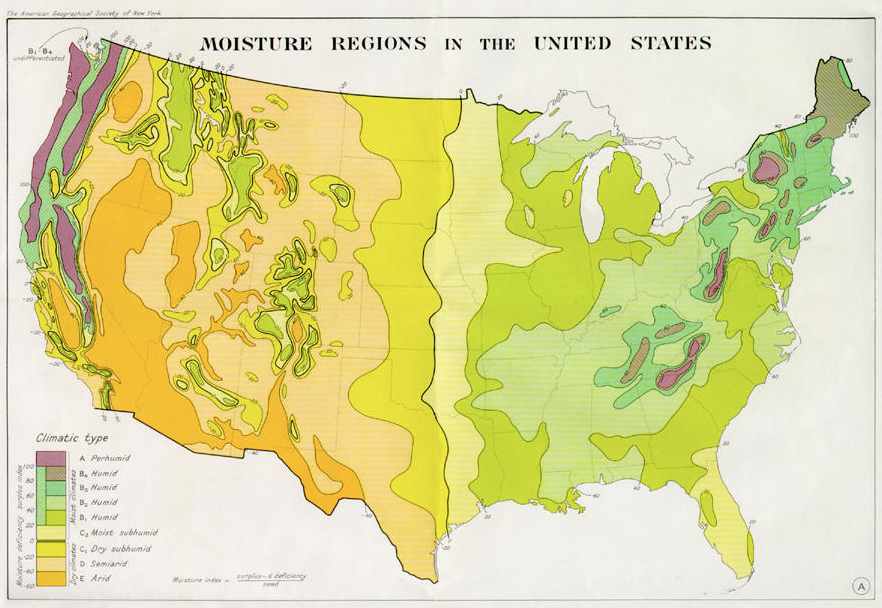
Take a look at this map, taken from the pages of the January 1948
issue of the /Geographical Review/. It appeared in an article named
"An Approach toward a Rational Classification of Climate":


The answer, our answer, at least, lies in the heavy line that eerily
traces the (then future) route of I-35 through our state. So, what does
the line represent?

First, a tip of the hat to the man who constructed it (and, while we're
tipping our hat, we're also smiling nervously at the GR's lawyers,
hoping they don't mind us posting a 60-year-old map here).

C. Warren Thornthwaite was a giant in climatology during the 20th
Century. Then, as now, the field was an amalgam of disciplines:
geographers, botanists, meteorologists, geologists, all kinds of
naturalist-observer-types. And Thornthwaite was comfortable dabbling
in all of the above. He wrote about a range of topics: Climate,
Rainfall, Hydrology, Ecology, Instrumentation, Man-Made Climate
Modification, US-Canada Relations, New Jersey Irrigation, and one of
our favorites: "The life history of rainstorms: progress report from
the Oklahoma Climatic Research Center."

(yep: Thornthwaite was a Sooner for a decade or so, and did much of
the early applied climatology work that OCS is now charged to do)

Anyway, for all his enviable well-roundedness, Thornthwaite knew that
the nexus of terrestrial climate was water. And not just what fell from
the sky, and not just what traveled in streams, but particularly what
was surrendered by the earth and its plant life. His early work in
evapo-transpiration is, well, legendary.

Dr. Thornthwaite was keenly concerned "water deficiency", (periods
of time when evaporative demand outpaced precipitation) and "water
surplus (vice versa). On the map shown above, the heavy line
represents those points at which (according to his estimations and
calculations) the amount of "water deficiency" matched the amount
of "surplus" over the course of the year. Areas west of the line
have a net-negative water year (a "drying climate"). East of the line,
precipitation outpaces evaporative effects.

Our understanding of the details has evolved in the 60 years since,
but Thornthwaite's map and the "Thornthwaite Zero Line" still make
a striking case for the role of the net water budget and the
demarcation of large tree species.
June 30 in Mesonet History
| Record | Value | Station | Year |
|---|---|---|---|
| Maximum Temperature | 109°F | HOOK | 2012 |
| Minimum Temperature | 55°F | SEIL | 2008 |
| Maximum Rainfall | 5.07″ | BUFF | 1999 |
Mesonet records begin in 1994.
Search by Date
If you're a bit off, don't worry, because just like horseshoes, “almost” counts on the Ticker website!