MESONET TICKER ... MESONET TICKER ... MESONET TICKER ... MESONET TICKER ...
December 27, 2011 December 27, 2011 December 27, 2011 December 27, 2011
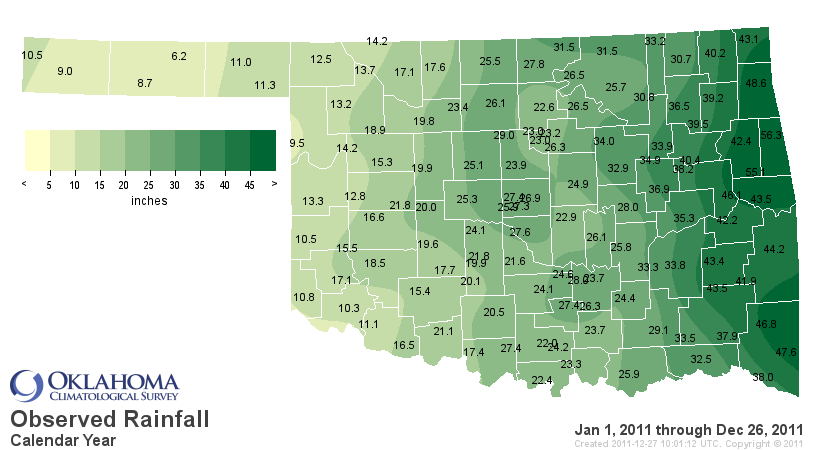
Regional views of Oklahoma's drought
It became fairly obvious early on that the western half of the state was going to
experience a heightened case of drought compared to eastern Oklahoma. Drought
relief in April and May brought the drought to a screeching halt in the eastern
one-third before the heat and dry weather brought it back in June. No such luck
for western Oklahoma, and the year-to-date precipitation map from the Oklahoma
Mesonet paints that picture quite well.
http://ticker.mesonet.org/archive/20111227/ytd-precip.png
Hooker is still bringing up the rear at 6.2 inches. As a reminder, the lowest
measured annual total for any single location in the state is 6.5 inches from
Regnier in 1956. But you can see the clear gradient from west to east. Now that
is also the normal gradient the state sees with decreasing totals as you go
higher and farther west. But superimposed on that gradient is the diminished
precipitation associated with the drought. It is almost certain that 2011 will
finish somewhere around the 10th driest in Oklahoma since records began in 1895.
I actually consider that a rather nice finish considering up through September we
were well on our way to the driest year on record.
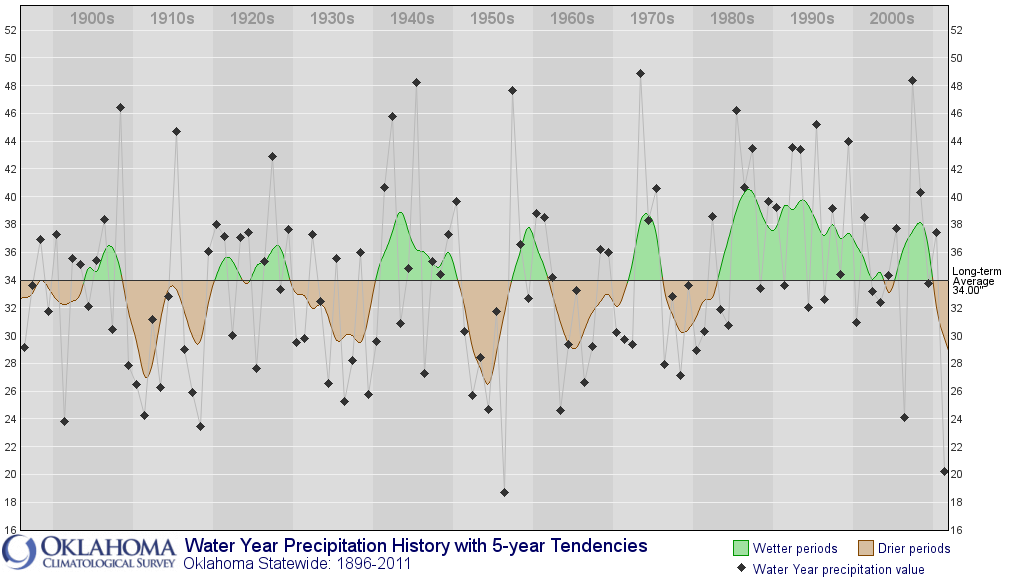
Let's remember that the drought started in October 2010, however. We sometimes
like to set beginning and ending dates based on the calendar that Mother Nature
simply doesn't care about. Let's take a look at the drought from beginning to
its zenith in September 2011. This is a look at the statewide average
precipitation total for each water year (October 1-September 30) from 1895
through this year.
http://ticker.mesonet.org/archive/20111227/statewide.WaterYear.png
A couple of things ... first off, the 2010-2011 (Oct 1, 2010-Sep 30, 2011)
water year was clearly the second driest on record statewide, second only to
the 1955-1956 water year. Second, the record also clearly shows the reduction
of variability starting in the 1980s and lasting through the current period.
All those dry water years tend to disappear in the last 30 years and we are left
with an unusually consistent wet period, with very few totals ending up in
negative territory. The severe droughts of 2005-06 and 2010-11 are in stark
contrast to every other period in the past three decades, and especially to the
2006-07 water year, the second wettest on record.
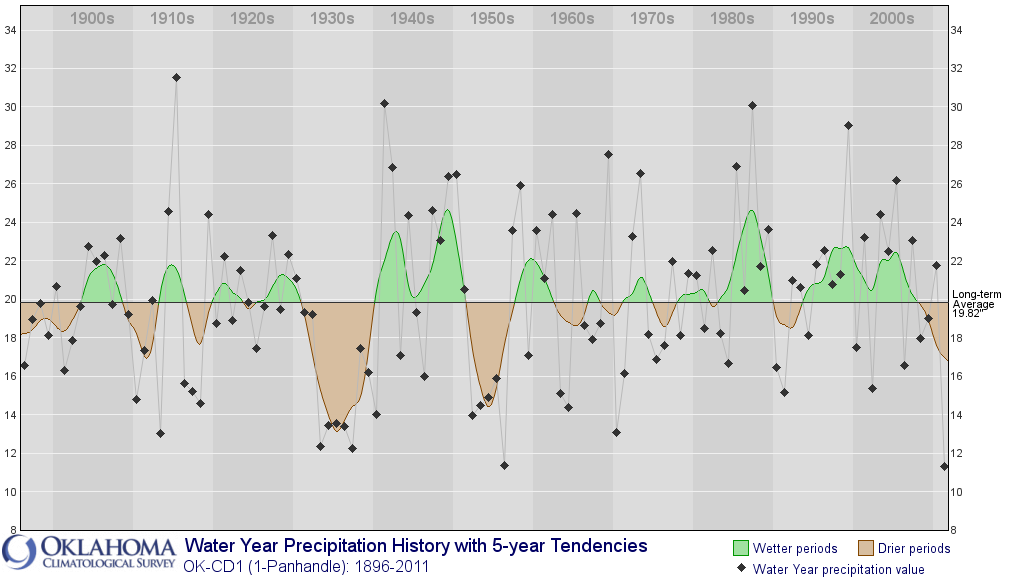
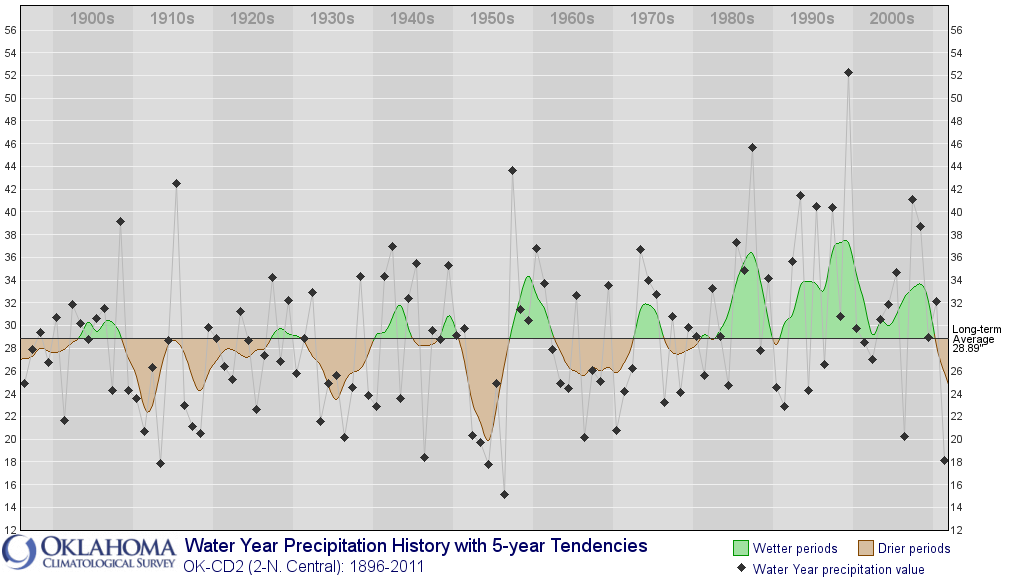
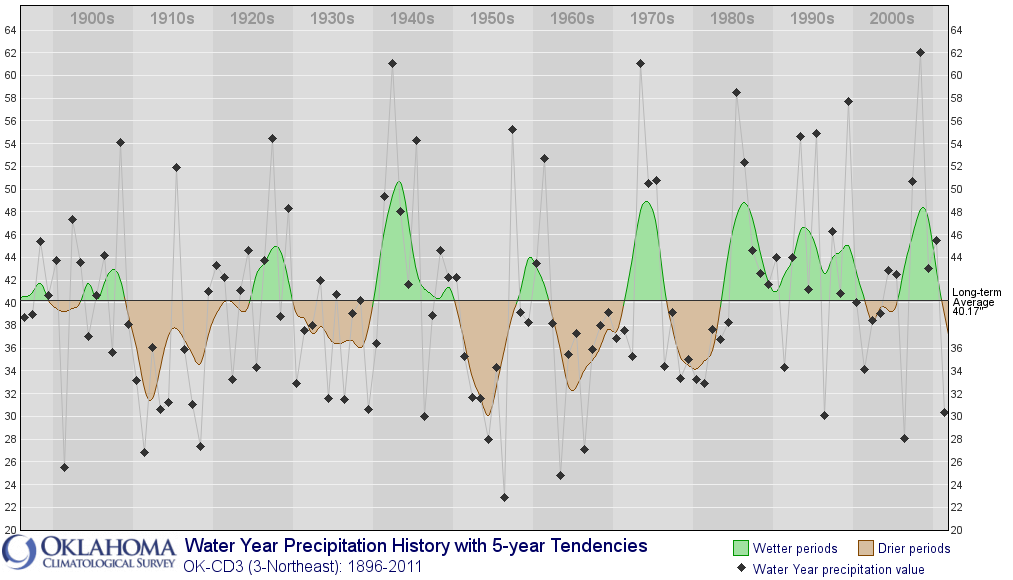
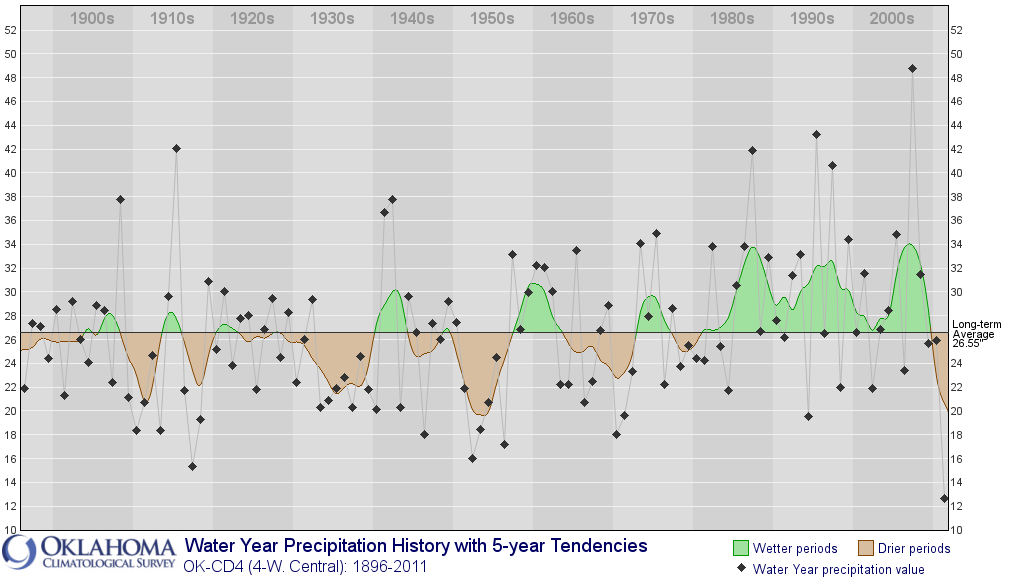
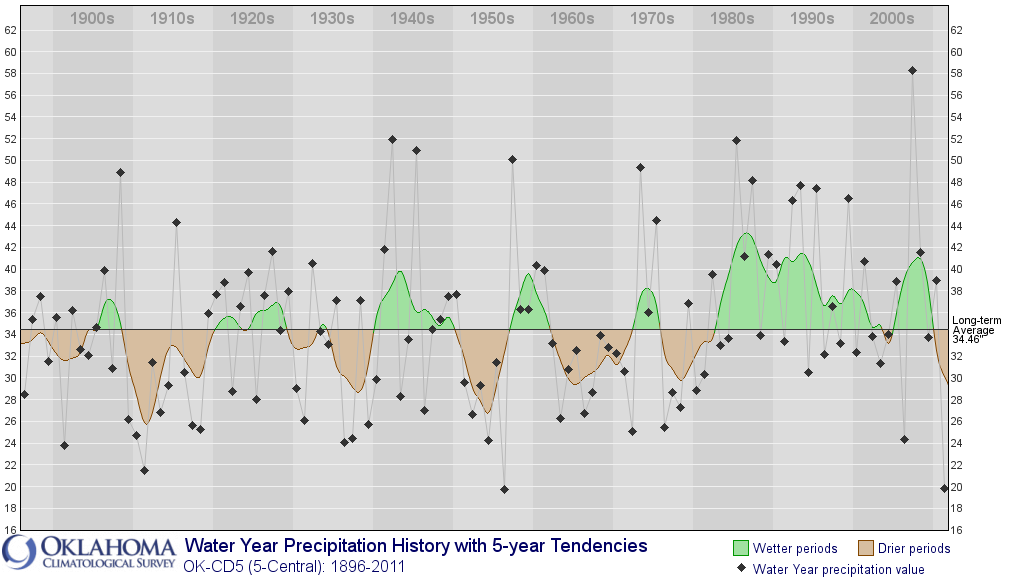
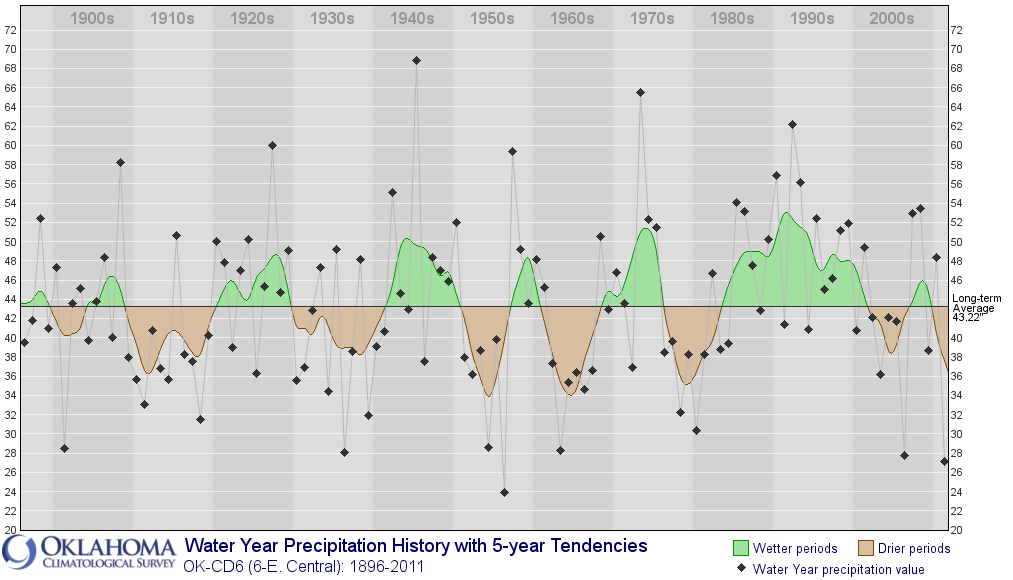
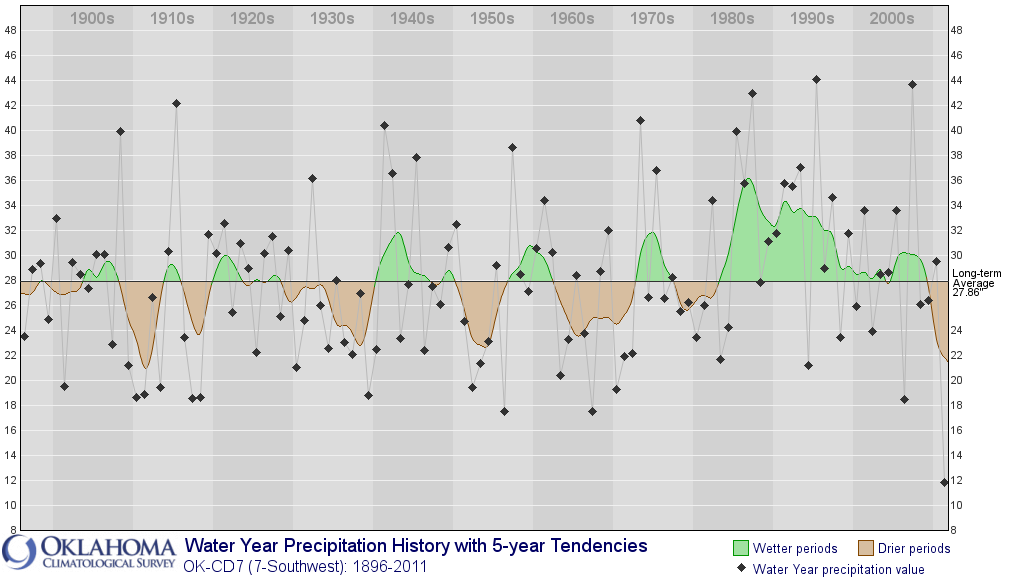
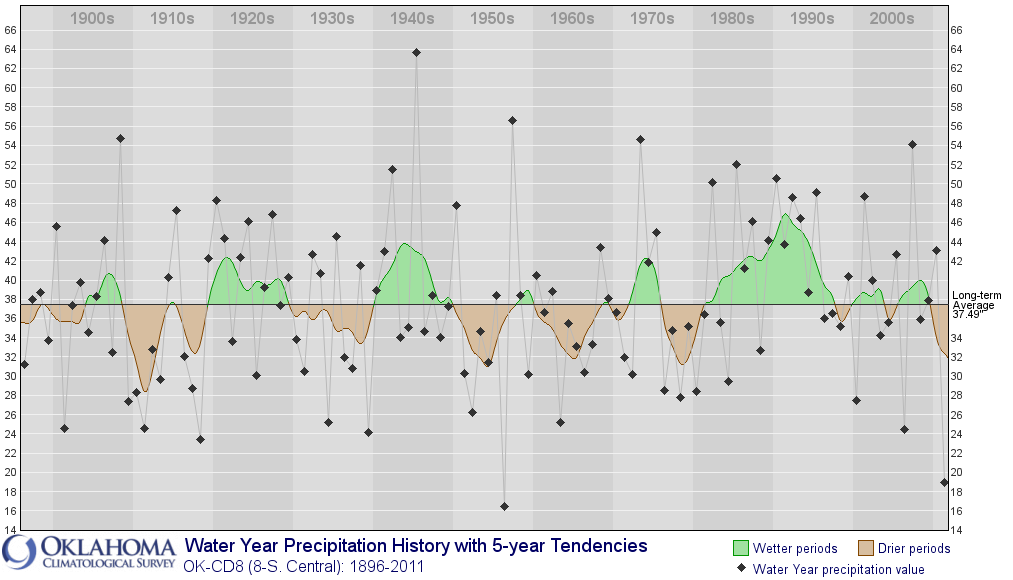
How about how other sections of the state fared? Look at the same graphs for
each of the nine climate divisions in Oklahoma.
OK climate divisions: http://ticker.mesonet.org/archive/20111227/cd_color.gif
CD1 (NW): http://ticker.mesonet.org/archive/20111227/NW_wateryear.png
CD2 (NC): http://ticker.mesonet.org/archive/20111227/NC_wateryear.png
CD3 (NE): http://ticker.mesonet.org/archive/20111227/NE_wateryear.png
CD4 (WC): http://ticker.mesonet.org/archive/20111227/WC_wateryear.png
CD5 (C): http://ticker.mesonet.org/archive/20111227/C_wateryear.png
CD6 (EC): http://ticker.mesonet.org/archive/20111227/EC_wateryear.png
CD7 (SW): http://ticker.mesonet.org/archive/20111227/SW_wateryear.png
CD8 (SC): http://ticker.mesonet.org/archive/20111227/SC_wateryear.png
CD9 (SE): http://ticker.mesonet.org/archive/20111227/SE_wateryear.png
The 2010-11 water year was the driest on record for the northwest, west central
and southwest climate divisions. For the southwest, it wasn't even close,
surpassing the previous lowest in 1956 by nearly 6 inches. Again, to beat a
previous 365-day record by nearly a third is astounding! West central beat
the previous driest water year (1951-52) in that area by 4 inches. This water
year was a virtual tie for driest on record for central Oklahoma, and in second
place for east central and south central Oklahoma.
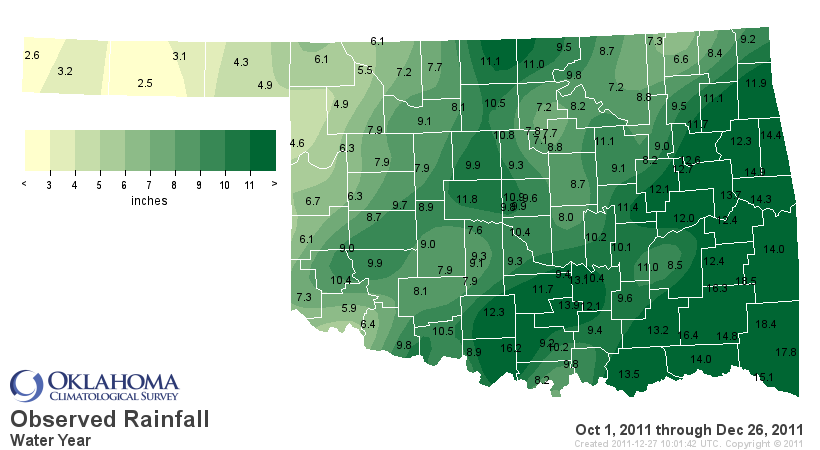
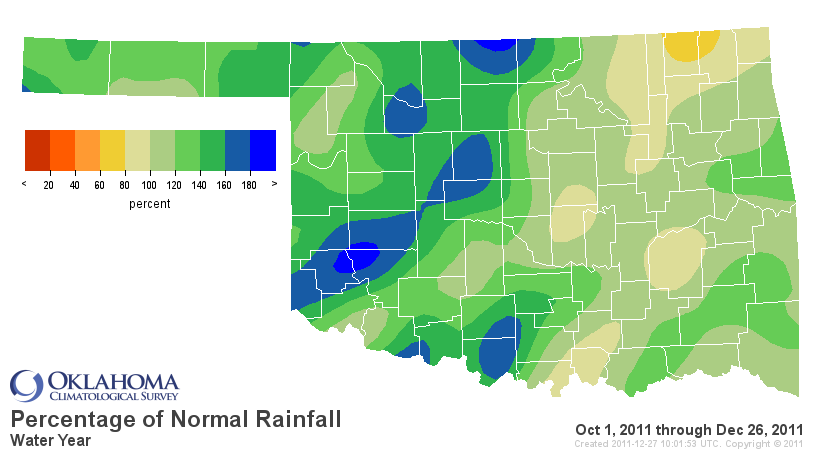
The current water year is off to a fabulous (and remarkable!!) start in its
first three months.
http://ticker.mesonet.org/archive/20111227/2011-12_wateryear.png
http://ticker.mesonet.org/archive/20111227/2011-12_wateryear_pct.png
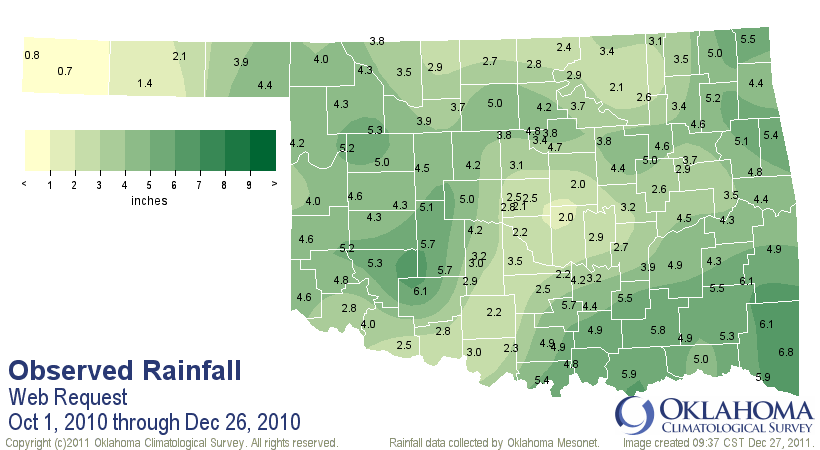
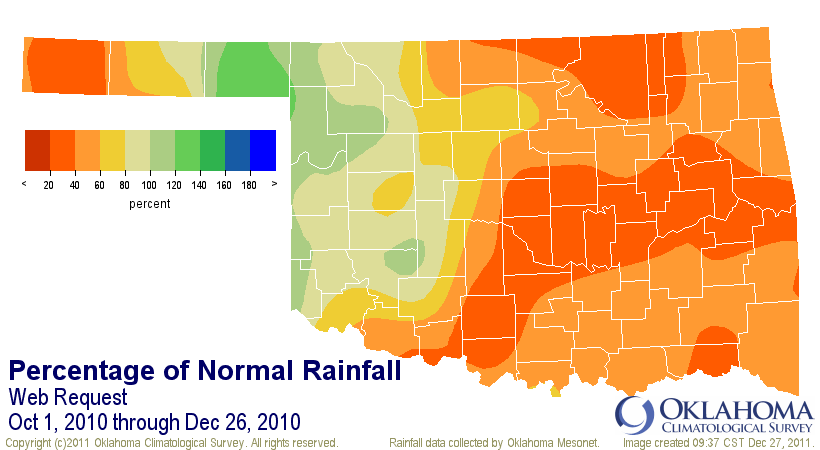
Certainly a much better start than last year's Oct 1-Dec 26 beginnings.
http://ticker.mesonet.org/archive/20111227/oct1-dec26_totals2010.png
http://ticker.mesonet.org/archive/20111227/oct1-dec26_pct2010.png
Gary McManus
Associate State Climatologist
Oklahoma Climatological Survey
(405) 325-2253
gmcmanus@mesonet.org
==================================================
The OCS/Mesonet Ticker
https://ticker.mesonet.org/
To subscribe or unsubscribe from the Ticker
or for questions about the Ticker or its content
Phone or Email the Ticker Manager at OCS
Phone: 405-325-2253 Email: ticker@mesonet.org
---------------------------------------------------
-C- Copyright 2024 Oklahoma Climatological Survey
===================================================
|


 Tweet
Tweet