MESONET TICKER ... MESONET TICKER ... MESONET TICKER ... MESONET TICKER ...
December 21, 2014 December 21, 2014 December 21, 2014 December 21, 2014
Some of my hair, Earl's tea and the first three weeks of December...
http://ticker.mesonet.org/archive/20141221/Carnac2.jpg
What is "grey."
I don't know who this "Earl" guy is, but me messed up my joke with his spelling
of gray, but let's just all pretend we're British and go with grey. And even
though my hair has fled my scalp like a herd of antelope on the African Savanna
being chased by a pack of lions, most of it's still its lustrous brown-ish black.
But it's also no secret that Mother Nature took away the sun this month and
appears reluctant to give it back. We just happen to have a statewide network of
pyranometers on the Mesonet that measure the incoming radiation from the sun as
proof.
Proof of what you say? That this has been the least sunny first three weeks of
December since the Mesonet was commissioned in 1994. You can view the current
amount of sunlight (at least in the form of solar radiation) and also the daily
total for the current day here:
http://www.mesonet.org/index.php/weather/category/solar_radiation_satellite
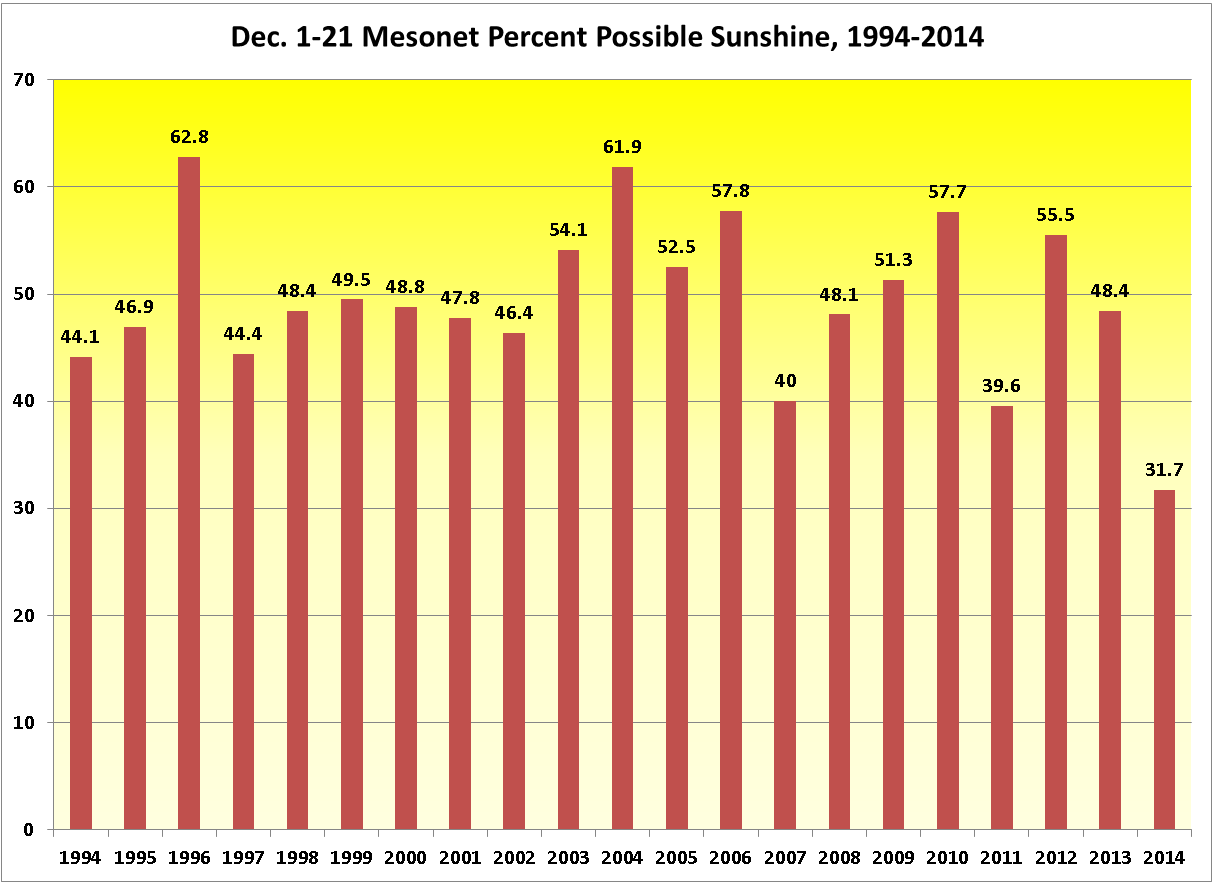
But what if we took all those daily totals for Dec. 1-21 for all the years since
1994 and compared them versus the theoretical maximum for each of those periods?
In other words, how much did the Mesonet measure versus the theoretical maximum
that could be expected to reach the surface if we had no atmosphere (thus
removing the impact of clouds, fog, haze, terrain, etc. etc., but mostly
clouds).
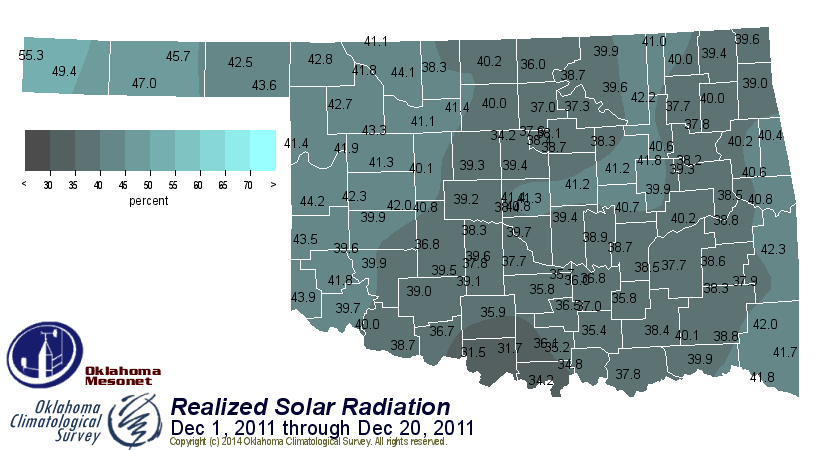
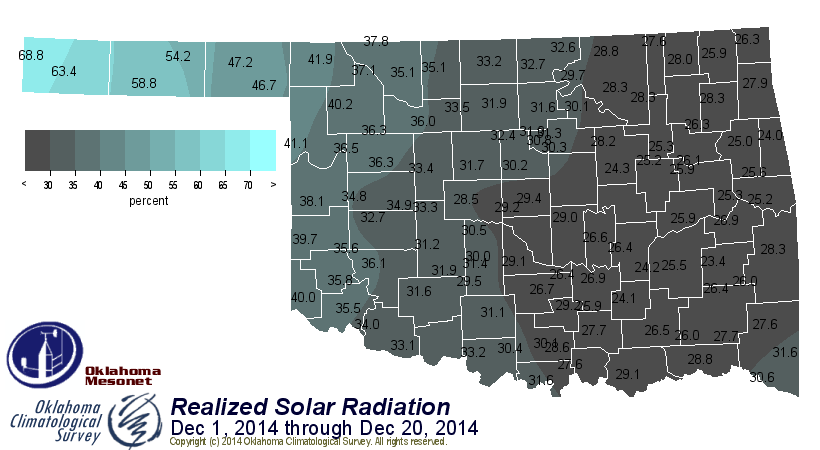
Here are the values in graphical form. Pretty easy to see at 31.7% that the
current Dec. 1-21 period easily outpaces the next "grayest" period of Dec.
1-21, 2011.
http://ticker.mesonet.org/archive/20141221/dec1-21-pct.sunshine.png
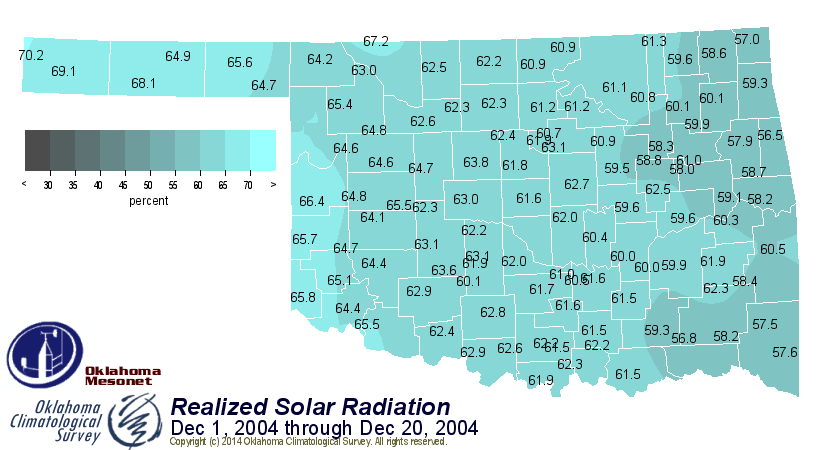
And we can only dream of the glorious sunshine of 1996 (62.8) and 2004 (61.9).
Something else strikes us, however...in general, at least in the 21 years of
Mesonet data, it's generally not too sunny during December. We're not talking
Seattle miserableness here, but it's generally less than 50% of possible
sunshine.
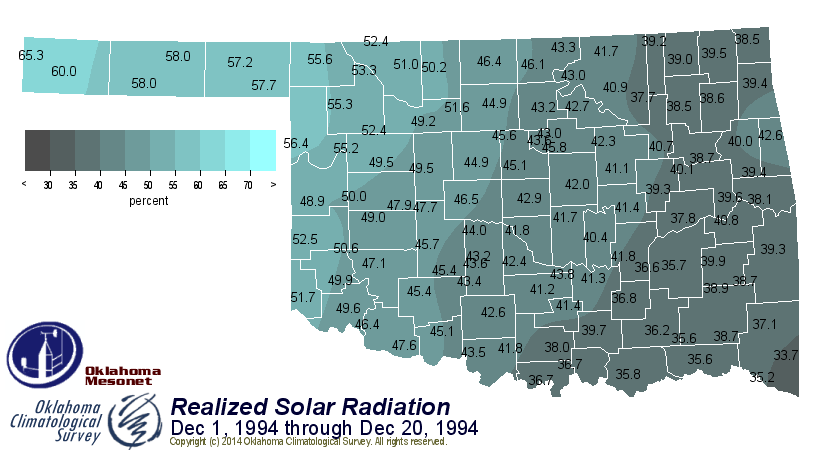
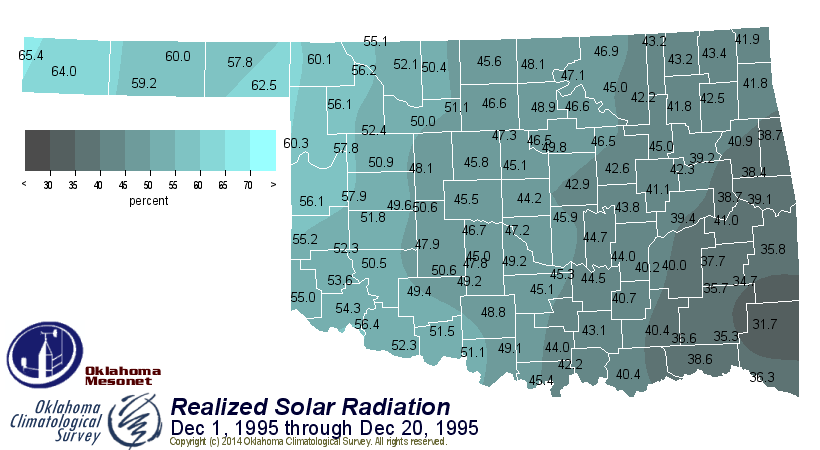
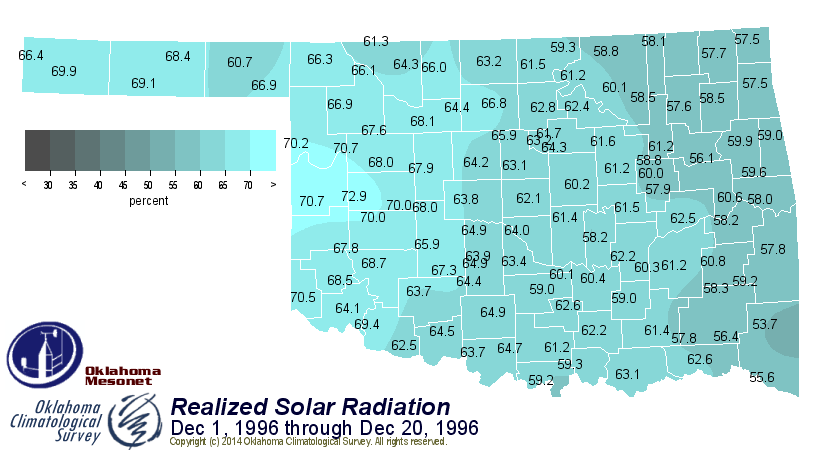
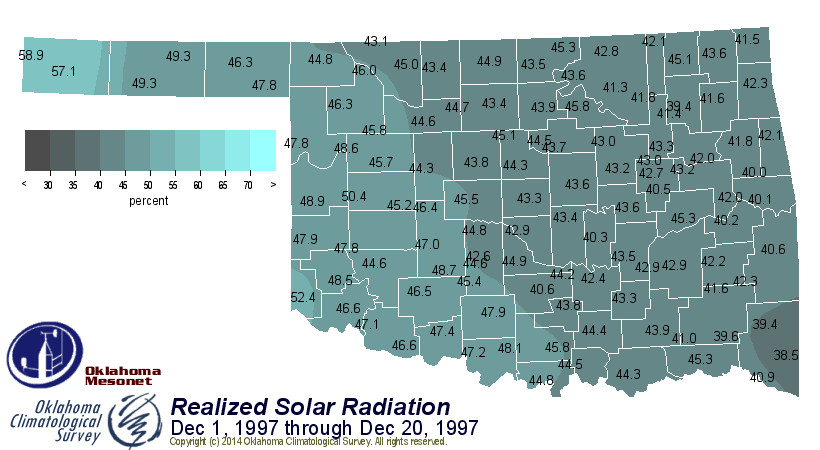
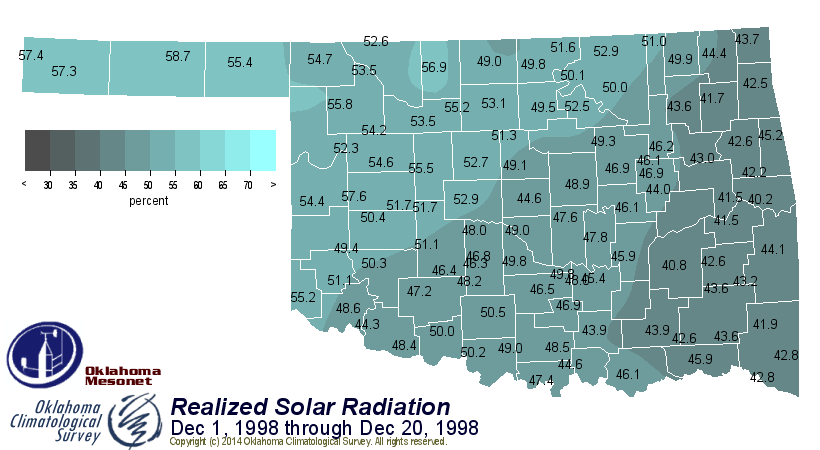
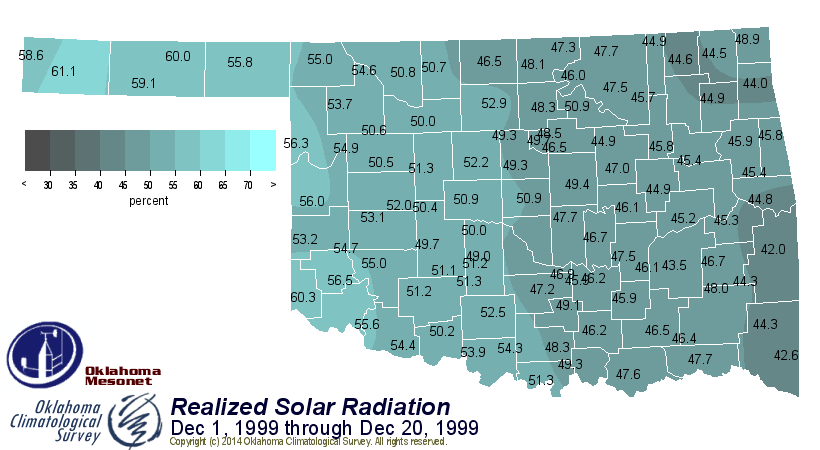
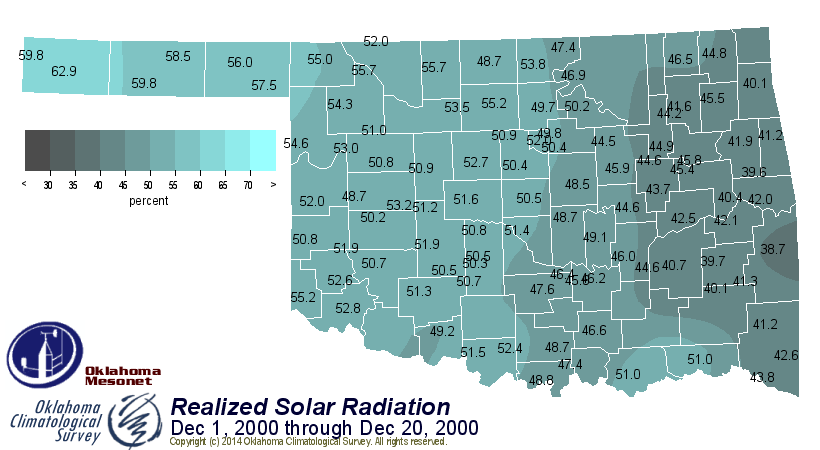
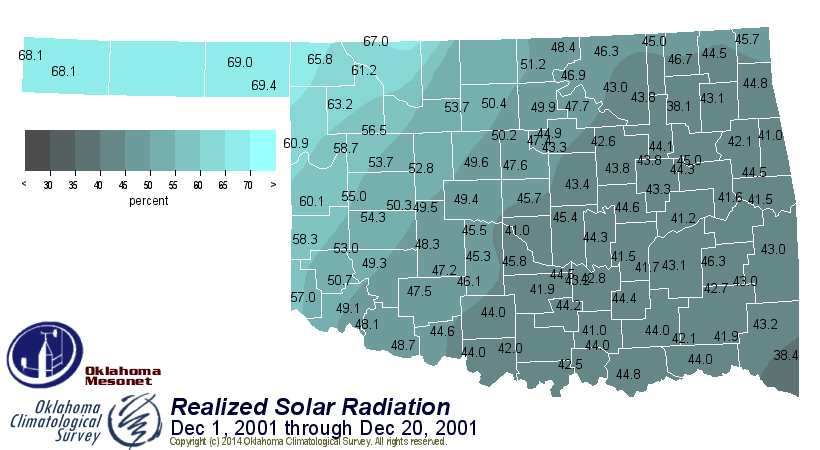
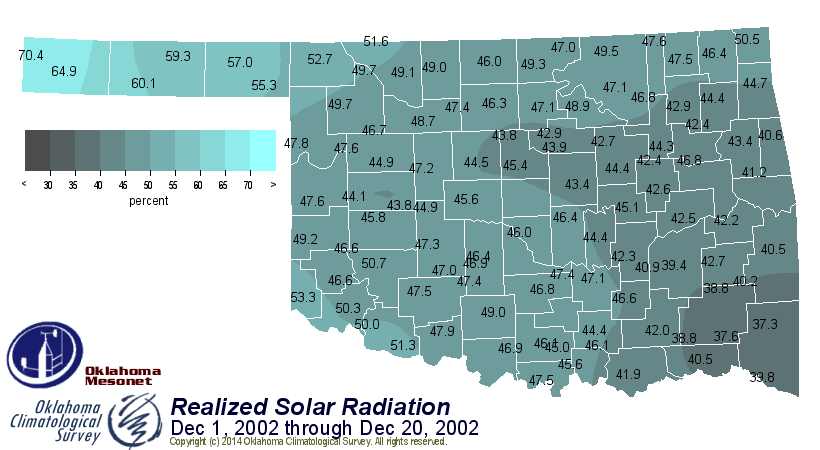
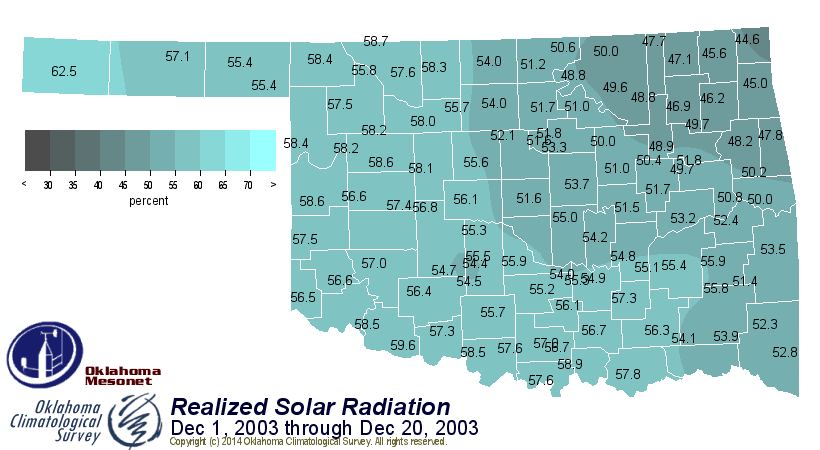
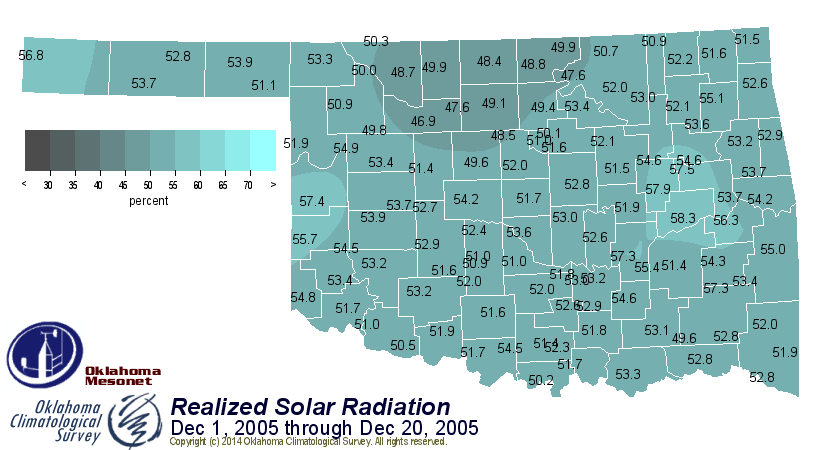
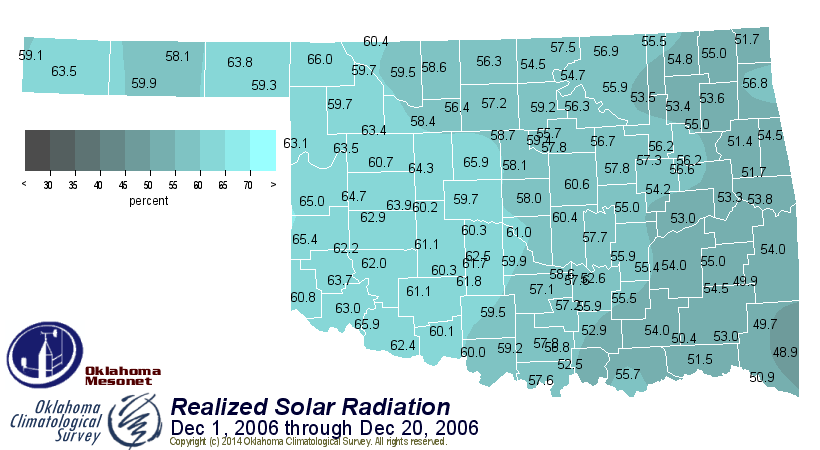
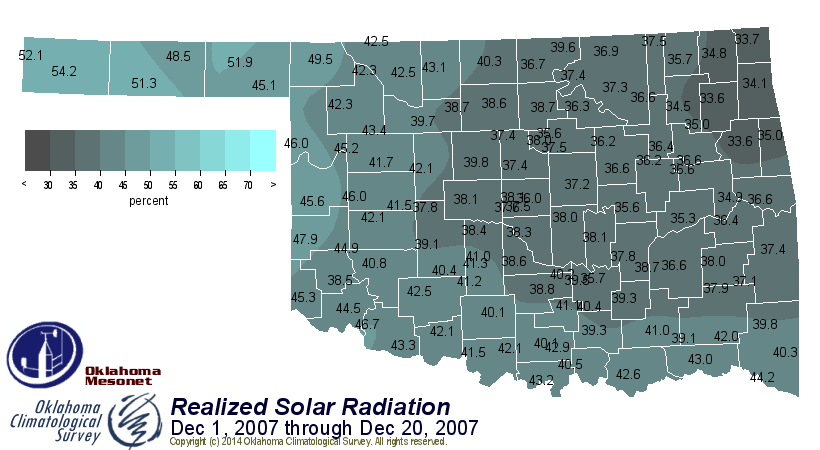
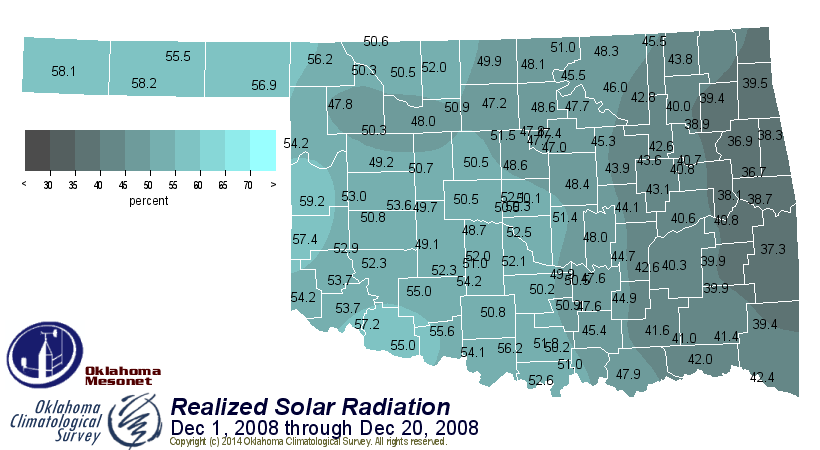
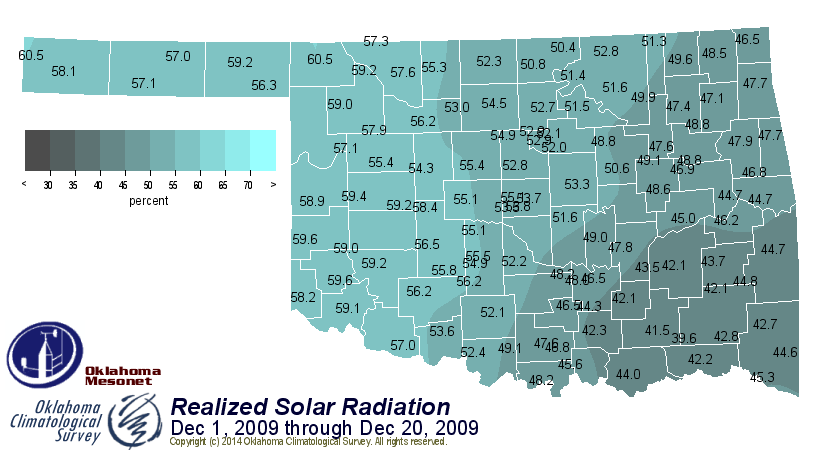
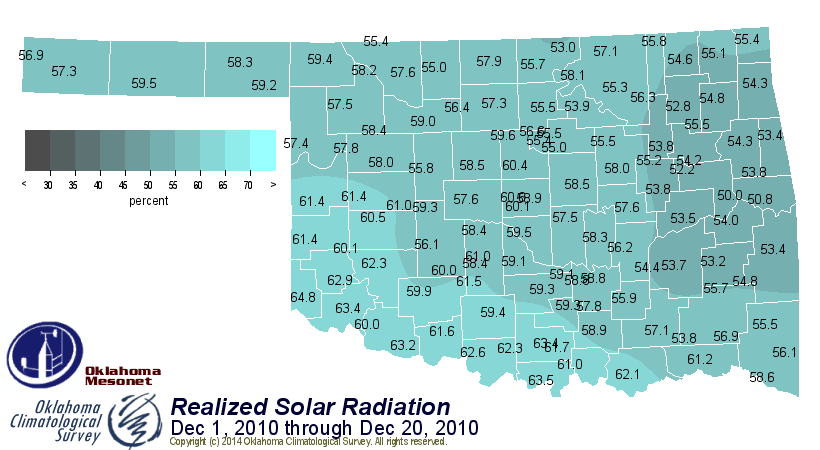
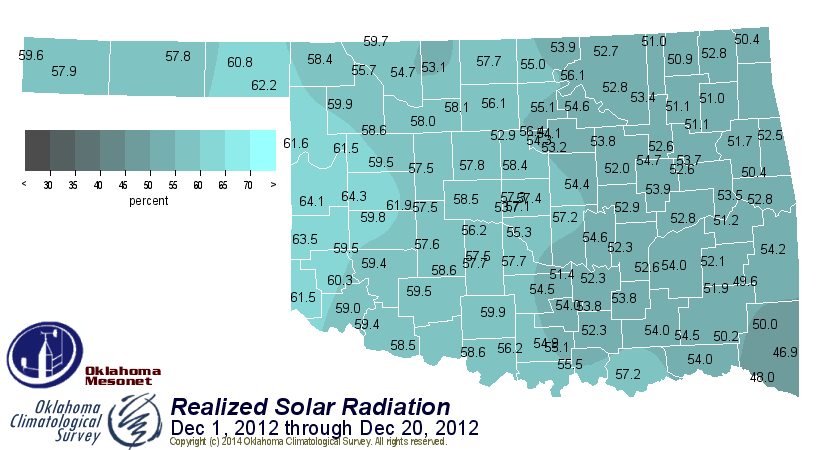
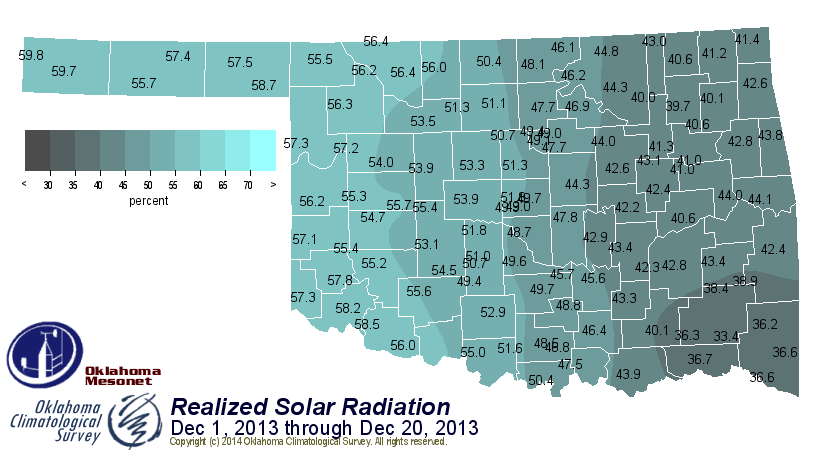
Now if we look year by year (again, for the Dec. 1-21 period), we can also see
the non-shocking result that it's generally "sunnier" in western Oklahoma than
eastern Oklahoma. The access to what little Gulf Moisture that makes it up this
way in December still provides more cloudiness for the eastern half of the state.
http://ticker.mesonet.org/archive/20141221/srad.199412.png
http://ticker.mesonet.org/archive/20141221/srad.199512.png
http://ticker.mesonet.org/archive/20141221/srad.199612.png
http://ticker.mesonet.org/archive/20141221/srad.199712.png
http://ticker.mesonet.org/archive/20141221/srad.199812.png
http://ticker.mesonet.org/archive/20141221/srad.199912.png
http://ticker.mesonet.org/archive/20141221/srad.200012.png
http://ticker.mesonet.org/archive/20141221/srad.200112.png
http://ticker.mesonet.org/archive/20141221/srad.200212.png
http://ticker.mesonet.org/archive/20141221/srad.200312.png
http://ticker.mesonet.org/archive/20141221/srad.200412.png
http://ticker.mesonet.org/archive/20141221/srad.200512.png
http://ticker.mesonet.org/archive/20141221/srad.200612.png
http://ticker.mesonet.org/archive/20141221/srad.200712.png
http://ticker.mesonet.org/archive/20141221/srad.200812.png
http://ticker.mesonet.org/archive/20141221/srad.200912.png
http://ticker.mesonet.org/archive/20141221/srad.201012.png
http://ticker.mesonet.org/archive/20141221/srad.201112.png
http://ticker.mesonet.org/archive/20141221/srad.201212.png
http://ticker.mesonet.org/archive/20141221/srad.201312.png
http://ticker.mesonet.org/archive/20141221/srad.201412.png
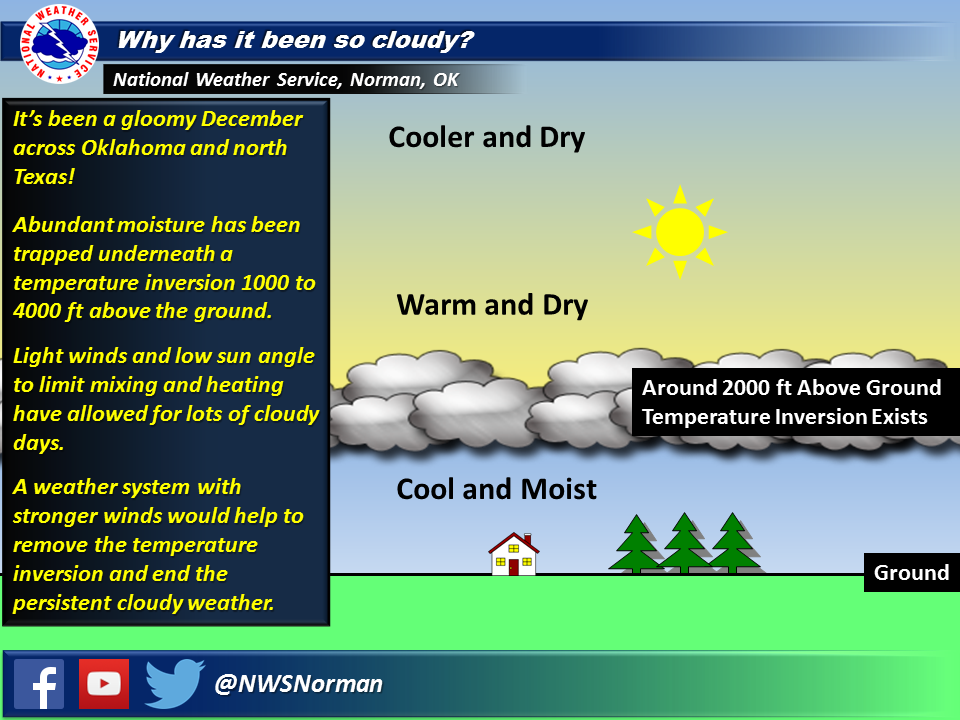
So what the heck's been going on with all this cloudiness, and will it go away
soon? Well, our friends at the Norman NWS office gave a pretty good graphical
explanation, and it has to do with the vertical profile of moisture and
temperature in the atmosphere, and also the lack of wind. Take a look for this
easy to understand explanation.
http://ticker.mesonet.org/archive/20141221/NWS-norman-cloudy-days.png
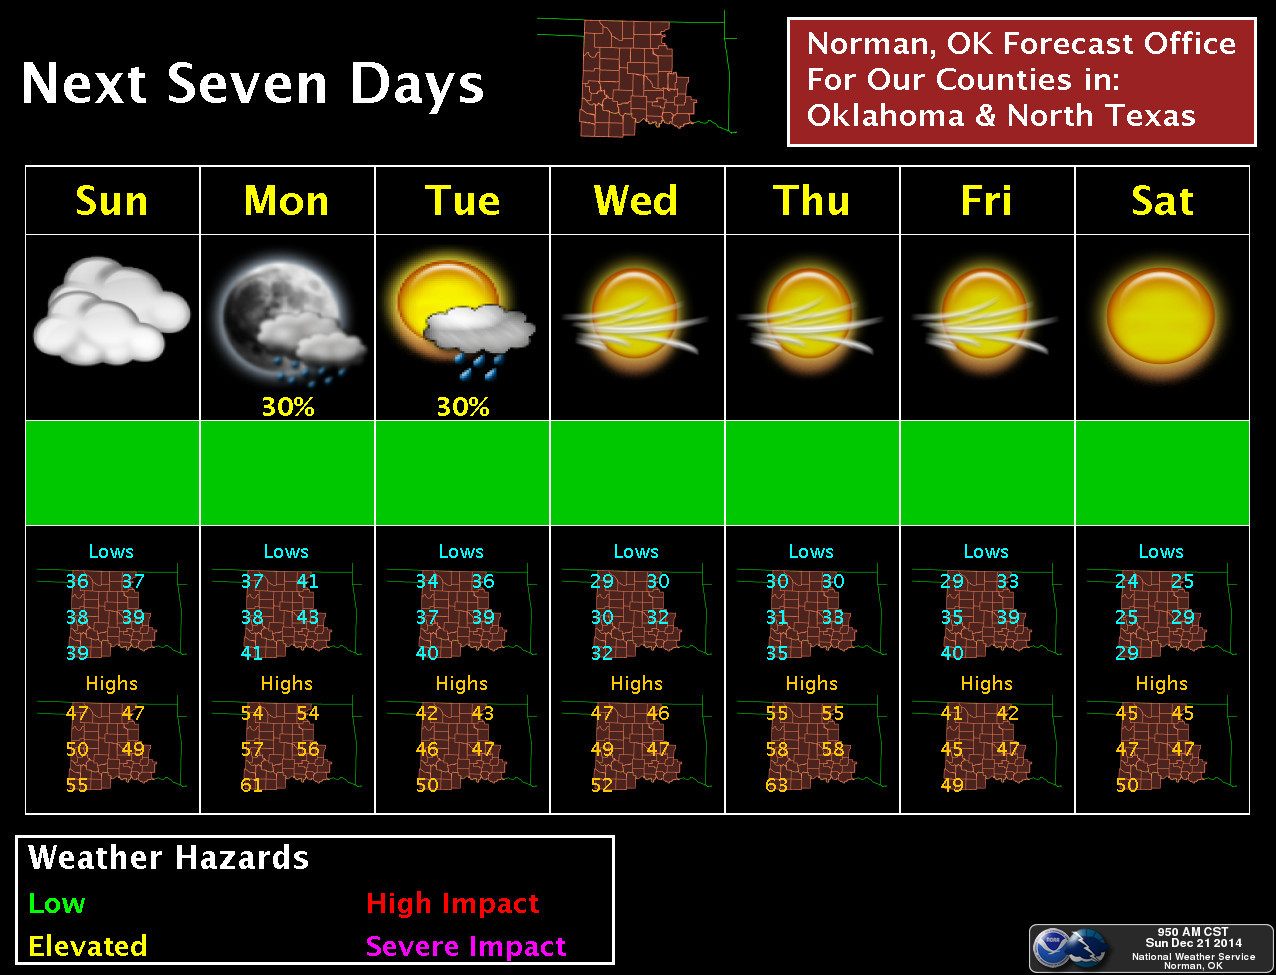
We also look to those folks for harbingers of good tidings and joy (i.e., THE
SUN!). Lo and behold, after a couple/three more days of this mess, looks like
we'll finally see some pretty good skies ahead.
http://ticker.mesonet.org/archive/20141221/nws-norman-7day-planner.jpg
Yeah, highs in the upper 50s for Christmas Day. DEAL WITH IT! You don't hear
Australians complaining about highs in the 100s on Christmas Day, do you?
But remember this special gift from the Mesonet...actual proof of this BAH
HUMBUG weather over the last three weeks.
Gary McManus
State Climatologist
Oklahoma Mesonet
Oklahoma Climatological Survey
(405) 325-2253
gmcmanus@mesonet.org
==================================================
The OCS/Mesonet Ticker
https://ticker.mesonet.org/
To subscribe or unsubscribe from the Ticker
or for questions about the Ticker or its content
Phone or Email the Ticker Manager at OCS
Phone: 405-325-2253 Email: ticker@mesonet.org
---------------------------------------------------
-C- Copyright 2024 Oklahoma Climatological Survey
===================================================
|


 Tweet
Tweet